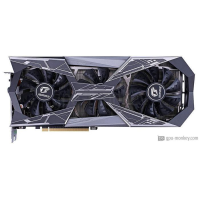
Colorful iGame GeForce RTX 2080 Ti Vulcan X OC-V
Colorful iGame GeForce RTX 2080 Ti Vulcan X OC-V launched Q3/2018, which is based on NVIDIA GeForce RTX 2080 Ti architecture. It will come with 11 GB of high-bandwidth GDDR6 memory.The Colorful iGame GeForce RTX 2080 Ti Vulcan X OC-V features 4352 shader, 88 render output units, has a boost clock of 1.770 GHz+ 15 % and equipped with a power draw of 250 W. The GPU supports up to 4 monitors with resolutions of 7680x4320. In addition, if you are looking for Air cooling cooler & Axial fan-type, it would be your best choice.
| Based on | NVIDIA GeForce RTX 2080 Ti |
| GPU Chip | TU102 |
| Execution units | 68 |
| Shader | 4352 |
| Render Output Units | 88 |
| Texture Units | 272 |
| Memory Size | 11 GB |
| Memory Type | GDDR6 |
| Memory Speed | 1.75 GHz |
| Memory Bandwith | 616 GB/s |
| Memory Interface | 352 bit |
Where to Buy?
Buy Colorful iGame GeForce RTX 2080 Ti Vulcan X OC-V
Clock Speeds
| Base Clock | 1.350 GHz |
| Boost Clock | 1.770 GHz + 15 % + 15 % |
| Avg (Game) Clock | |
| Overclocking |
Yes |
Thermal Design
| TDP | 250 W |
| TDP (up) | -- |
| Tjunction max | -- |
| PCIe-Power | 3 x 8-Pin |
Cooler & Fans
| Fan-Type | Axial |
| Fan 1 | 2 x 90 mm |
| Fan 2 | 1 x 80 mm |
-
| Cooler-Type | Air cooling |
| Noise (Idle) | 0 dB / Silent |
| Noise (Load): | -- |
Connectivity
| Max. Displays | 4 |
| HDCP-Version | 2.2 |
| HDMI Ports | -- |
| DP Ports | 3x DP v1.4a |
| DVI Ports | -- |
| VGA Ports | -- |
| USB-C Ports | 1 |
Featureset
| Max. resolution | 7680x4320 |
| DirectX | 12_2 |
| Raytracing |
Yes |
| DLSS / FSR |
Yes |
| LED | iGame Energy Core |
Supported Video Codecs
| h264 | Decode / Encode |
| h265 / HEVC | Decode / Encode |
| AV1 |
No |
-
| VP8 | Decode |
| VP9 | Decode |
| Noise (Load): | -- |
Dimensions
| Length | 318 mm |
| Height | 147 mm |
| Width | 59 mm |
| Width (Slots) | 3 PCIe-Slots |
| Weight | 1400 g |
Additional data
| GPU Interface | PCIe 3.0 x 16 |
| Release date | Q3/2018 |
| Release price | -- |
| Structure size | 12 nm |
| Part-no | -- |
FP32 Performance (Single-precision TFLOPS) - FP32 (TFLOPS)
ASUS ROG Matrix GeForce RTX 2080 Ti Platinum
15.8 (39%)
ZOTAC GAMING GeForce RTX 2080 Ti AMP Extreme
15.8 (39%)
Colorful iGame GeForce RTX 2080 Ti Vulcan X OC-V
15.41 (38%)
ASUS ROG Strix GeForce RTX 2080 Ti OC White
15.41 (38%)
MSI GeForce RTX 2080 Ti Lightning Z
15.41 (38%)
3DMark Benchmark - Time Spy (Performance) Graphics score
GIGABYTE Radeon RX 6800 Gaming OC 16G
15110 (72%)
MSI Radeon RX 6800 Gaming X Trio 16G
15110 (72%)
Colorful iGame GeForce RTX 2080 Ti Vulcan X OC-V
15071 (72%)
ASUS ROG Strix GeForce RTX 2080 Ti OC White
15071 (72%)
MSI GeForce RTX 2080 Ti Lightning Z
15071 (72%)
3DMark Benchmark - Fire Strike (Extreme) Graphics score
Gainward GeForce RTX 3070 Phoenix GS V1 LHR
17309 (59%)
MSI GeForce RTX 3070 Gaming Trio Plus 8G
17309 (59%)
Colorful iGame GeForce RTX 2080 Ti Vulcan X OC-V
17274 (58%)
ASUS ROG Strix GeForce RTX 2080 Ti OC White
17274 (58%)
MSI GeForce RTX 2080 Ti Lightning Z
17274 (58%)
Battlefield 5 - 3840x2160 (2160p)
GALAX GeForce RTX 3070 Ti EXG White (1-Click OC)
85 fps (avg) (71%)
GALAX GeForce RTX 3070 Ti EXG (1-Click OC)
85 fps (avg) (71%)
Colorful iGame GeForce RTX 2080 Ti Vulcan X OC-V
84 fps (avg) (71%)
ASUS ROG Strix GeForce RTX 2080 Ti OC White
84 fps (avg) (71%)
MSI GeForce RTX 2080 Ti Gaming Z Trio
84 fps (avg) (71%)
Battlefield 5 - 2560x1440 (1440p)
ASUS ROG Matrix GeForce RTX 2080 Ti Platinum
142 fps (avg) (71%)
MSI GeForce RTX 3070 Gaming X Trio 8G
142 fps (avg) (71%)
Colorful iGame GeForce RTX 2080 Ti Vulcan X OC-V
141 fps (avg) (70%)
GIGABYTE GeForce RTX 3070 Gaming OC 8G
141 fps (avg) (70%)
GIGABYTE GeForce RTX 3070 Vision OC 8G
141 fps (avg) (70%)
Battlefield 5 - 1920x1080 (1080p)
ASUS ROG Matrix GeForce RTX 2080 Ti Platinum
193 fps (avg) (96%)
MSI Radeon RX 6800
193 fps (avg) (96%)
Colorful iGame GeForce RTX 2080 Ti Vulcan X OC-V
192 fps (avg) (95%)
ASUS ROG Strix GeForce RTX 2080 Ti OC White
192 fps (avg) (95%)
MSI GeForce RTX 2080 Ti Lightning Z
192 fps (avg) (95%)
Shadow of the Tomb Raider - 3840x2160 (2160p)
GIGABYTE Radeon RX 6800 Gaming 16G
63 fps (avg) (66%)
XFX SPEEDSTER SWFT 319 Radeon RX 6800 CORE
63 fps (avg) (66%)
Colorful iGame GeForce RTX 2080 Ti Vulcan X OC-V
62 fps (avg) (65%)
ASUS ROG Strix GeForce RTX 2080 Ti OC White
62 fps (avg) (65%)
ASUS ROG Matrix GeForce RTX 2080 Ti Platinum
62 fps (avg) (65%)
Shadow of the Tomb Raider - 2560x1440 (1440p)
ZOTAC GAMING GeForce RTX 2080 Ti AMP Extreme
115 fps (avg) (73%)
Colorful iGame GeForce RTX 2080 Ti Kudan-V
115 fps (avg) (73%)
Colorful iGame GeForce RTX 2080 Ti Vulcan X OC-V
114 fps (avg) (72%)
ASUS ROG Strix GeForce RTX 2080 Ti OC White
114 fps (avg) (72%)
MSI GeForce RTX 2080 Ti Lightning Z
114 fps (avg) (72%)
Shadow of the Tomb Raider - 1920x1080 (1080p)
ASUS ROG Matrix GeForce RTX 2080 Ti Platinum
149 fps (avg) (74%)
Colorful iGame GeForce RTX 2080 Ti Kudan-V
149 fps (avg) (74%)
Colorful iGame GeForce RTX 2080 Ti Vulcan X OC-V
148 fps (avg) (74%)
ASUS ROG Strix GeForce RTX 2080 Ti OC White
148 fps (avg) (74%)
MSI GeForce RTX 2080 Ti Lightning Z
148 fps (avg) (74%)
Crypto-Mining Ethereum Hashrate (MH/s) - Ethash Hashrate
MSI GeForce RTX 3060 Ti Gaming X 8G
61 MH/s (50%)
Palit GeForce RTX 3060 Ti Dual
61 MH/s (50%)
Colorful iGame GeForce RTX 2080 Ti Vulcan X OC-V
60 MH/s (50%)
ASUS ROG Strix GeForce RTX 2080 Ti OC White
60 MH/s (50%)
ASUS ROG Matrix GeForce RTX 2080 Ti Platinum
60 MH/s (50%)
Crypto-Mining Ergo Hashrate (MH/s) - Autolykos 2 Hashrate
ASUS ROG Matrix GeForce RTX 2080 Ti Platinum
119 MH/s (45%)
ZOTAC GAMING GeForce RTX 2080 Ti AMP Extreme
119 MH/s (45%)
Colorful iGame GeForce RTX 2080 Ti Vulcan X OC-V
118 MH/s (45%)
ASUS ROG Strix GeForce RTX 2080 Ti OC White
118 MH/s (45%)
MSI GeForce RTX 2080 Ti Gaming Z Trio
118 MH/s (45%)
Crypto-Mining Ravencoin Hashrate (MH/s) - KawPow Hashrate
EVGA GeForce RTX 3070 Ti XC3 GAMING
38 MH/s (78%)
INNO3D GeForce RTX 3070 Ti X3 OC
38 MH/s (78%)
Colorful iGame GeForce RTX 2080 Ti Vulcan X OC-V
34 MH/s (69%)
ASUS ROG Strix GeForce RTX 2080 Ti OC White
34 MH/s (69%)
ASUS ROG Matrix GeForce RTX 2080 Ti Platinum
34 MH/s (69%)
Crypto-Mining Vertcoin Hashrate (MH/s) - Verthash Hashrate
Colorful iGame GeForce RTX 2080 Ti Kudan-V
0.88 MH/s (45%)
XFX Speedster MERC 319 Radeon RX 6900 XT Limited Black Gaming
0.88 MH/s (45%)
Colorful iGame GeForce RTX 2080 Ti Vulcan X OC-V
0.87 MH/s (45%)
ASUS ROG Strix LC Radeon RX 6900 XT OC
0.87 MH/s (45%)
Sapphire Toxic Radeon RX 6900 XT Limited Edition (rev 2.0)
0.87 MH/s (45%)
Popular Comparision
ASUS EKWB GeForce RTX 3090 vs
Colorful iGame GeForce RTX 2080 Ti Vulcan X OC-V
ASUS TUF Gaming GeForce RTX 3060 OC Edition vs
Colorful iGame GeForce RTX 2080 Ti Vulcan X OC-V
ASUS Dual GeForce RTX 2080 vs
Colorful iGame GeForce RTX 2080 Ti Vulcan X OC-V
ASUS ROG Strix GeForce RTX 2080 Ti OC vs
Colorful iGame GeForce RTX 2080 Ti Vulcan X OC-V
ASUS Dual GeForce RTX 3060 vs
Colorful iGame GeForce RTX 2080 Ti Vulcan X OC-V
ASUS ROG Strix GeForce RTX 2080 Ti OC White vs
Colorful iGame GeForce RTX 2080 Ti Vulcan X OC-V
GALAX GeForce RTX 2080 Ti SG (1-Click OC) vs
Colorful iGame GeForce RTX 2080 Ti Vulcan X OC-V
Colorful iGame GeForce RTX 2070 Ultra V2-V vs
Colorful iGame GeForce RTX 2080 Ti Vulcan X OC-V
ASUS Dual GeForce RTX 2070 SUPER EVO vs
Colorful iGame GeForce RTX 2080 Ti Vulcan X OC-V
ASUS TUF Gaming GeForce RTX 3070 Ti OC Edition vs
Colorful iGame GeForce RTX 2080 Ti Vulcan X OC-V
GIGABYTE Radeon RX 580 Gaming 4G vs
Colorful iGame GeForce RTX 2080 Ti Vulcan X OC-V
Colorful iGame GeForce RTX 2080 Ti Vulcan X OC-V vs
Colorful iGame GeForce RTX 3060 Ti Vulcan OC LHR-V