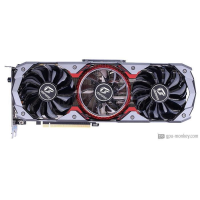
Colorful iGame GeForce RTX 2070 SUPER Advanced OC-V
Colorful iGame GeForce RTX 2070 SUPER Advanced OC-V hat Q3/2019 gestartet, das auf der NVIDIA GeForce RTX 2070 SUPER-Architektur basiert. Es wird mit 8 GB von GDDR6-Speicher mit hoher Bandbreite geliefert.Die Colorful iGame GeForce RTX 2070 SUPER Advanced OC-V kennzeichnet 2560 - Shader, 64 Ausgabeeinheiten machen, hat eine boost Takt von 1.815 GHz+ 3 % ziehen und der mit einer Leistung ausgestattet 215 W . Die GPU unterstützt bis zu 4 Monitore mit Auflösungen von 7680x4320 . Wenn Sie außerdem nach einem Air cooling -Kühler und einem Axial suchen, ist dies die beste Wahl.
| Based on | NVIDIA GeForce RTX 2070 SUPER |
| GPU Chip | TU104 |
| Ausführungseinheiten | 40 |
| Shader | 2560 |
| Render Output Units | 64 |
| Texture Units | 160 |
| Memory Size | 8 GB |
| Memory Type | GDDR6 |
| Memory Speed | 1.75 GHz |
| Memory Bandwith | 448 GB/s |
| Memory Interface | 256 bit |
Wo zu kaufen?
Besorgen Colorful iGame GeForce RTX 2070 SUPER Advanced OC-V
Clock Speeds
| Base Clock | 1.605 GHz |
| Boost Clock | 1.815 GHz + 3 % + 3 % |
| Avg (Game) Clock | 1.770 GHz |
| Übertaktung |
Yes |
Thermal Design
| TDP | 215 W |
| TDP (up) | -- |
| Tjunction max | 88 °C |
| PCIe-Power | 2 x 8-Pin |
Cooler & Fans
| Fan-Type | Axial |
| Fan 1 | 2 x 90 mm |
| Fan 2 | 1 x 80 mm |
-
| Cooler-Type | Air cooling |
| Noise (Idle) | 0 dB / Silent |
| Noise (Load): | -- |
Connectivity
| Max. Displays | 4 |
| HDCP-Version | 2.2 |
| HDMI Ports | 1x HDMI v2.0b |
| DP Ports | 3x DP v1.4a |
| DVI Ports | -- |
| VGA Ports | -- |
| USB-C Ports | 1 |
Featureset
| Max. resolution | 7680x4320 |
| DirectX | 12_2 |
| Raytracing |
Yes |
| DLSS / FSR |
Yes |
| LED | iGame Energy Core |
Supported Video Codecs
| h264 | Decode / Encode |
| h265 / HEVC | Decode / Encode |
| AV1 |
No |
-
| VP8 | Decode |
| VP9 | Decode |
| Noise (Load): | -- |
Dimensions
| Length | 315 mm |
| Height | 136 mm |
| Width | 53 mm |
| Width (Slots) | 3 PCIe-Slots |
| Weight | 2020 g |
Additional data
| GPU Interface | PCIe 3.0 x 16 |
| Veröffentlichungsdatum | Q3/2019 |
| Release price | -- |
| Structure size | 12 nm |
| Part-no | -- |
FP32 Performance (Single-precision TFLOPS) - FP32 (TFLOPS)
Palit GeForce RTX 2070 SUPER GRP
9.37 (23%)
ZOTAC GeForce GTX 1080 AMP Edition
9.33 (23%)
EVGA GeForce RTX 2070 SUPER FTW3 ULTRA
9.29 (23%)
MSI GeForce RTX 2070 SUPER GAMING Z TRIO
9.29 (23%)
3DMark Benchmark - Time Spy (Performance) Graphics score
EVGA GeForce GTX 1080 Ti FTW3 HYBRID GAMING
10126 (48%)
EVGA GeForce GTX 1080 Ti FTW3 GAMING
10126 (48%)
EVGA GeForce RTX 2070 SUPER FTW3 ULTRA
10108 (48%)
MSI GeForce RTX 2070 SUPER GAMING Z TRIO
10108 (48%)
3DMark Benchmark - Fire Strike (Extreme) Graphics score
Palit GeForce RTX 2070 SUPER GRP
12020 (41%)
NVIDIA GeForce RTX 3080 Laptop (Mobile) - 125 W
11987 (41%)
EVGA GeForce RTX 2070 SUPER FTW3 ULTRA
11986 (41%)
MSI GeForce RTX 2070 SUPER GAMING Z TRIO
11986 (41%)
Battlefield 5 - 3840x2160 (2160p)
ASUS ROG Strix GeForce RTX 3060 OC Edition
56 fps (avg) (47%)
ZOTAC GAMING GeForce RTX 3060 AMP White Edition
56 fps (avg) (47%)
Colorful iGame GeForce RTX 2070 SUPER Advanced OC-V
55 fps (avg) (46%)
MSI GeForce RTX 3060 GAMING X Trio 12G
55 fps (avg) (46%)
MSI GeForce RTX 3060 GAMING X 12G
55 fps (avg) (46%)
Battlefield 5 - 2560x1440 (1440p)
MSI GeForce RTX 3060 VENTUS 2X 12G OC
101 fps (avg) (50%)
ZOTAC GAMING GeForce RTX 3060 Twin Edge OC
101 fps (avg) (50%)
Colorful iGame GeForce RTX 2070 SUPER Advanced OC-V
100 fps (avg) (50%)
MSI GeForce RTX 3060 AERO ITX 12G
100 fps (avg) (50%)
ZOTAC GAMING GeForce RTX 3060 Twin Edge
100 fps (avg) (50%)
Battlefield 5 - 1920x1080 (1080p)
INNO3D GeForce RTX 2070 SUPER ICHILL BLACK
132 fps (avg) (65%)
GIGABYTE AORUS GeForce RTX 2070 SUPER 8G
132 fps (avg) (65%)
Colorful iGame GeForce RTX 2070 SUPER Advanced OC-V
131 fps (avg) (65%)
EVGA GeForce RTX 2070 SUPER FTW3 ULTRA
131 fps (avg) (65%)
MSI GeForce RTX 2070 SUPER GAMING Z TRIO
131 fps (avg) (65%)
Shadow of the Tomb Raider - 3840x2160 (2160p)
ZOTAC GAMING GeForce RTX 3060 Twin Edge
43 fps (avg) (45%)
ZOTAC GAMING GeForce RTX 3060 Twin Edge OC
43 fps (avg) (45%)
Colorful iGame GeForce RTX 2070 SUPER Advanced OC-V
42 fps (avg) (44%)
EVGA GeForce RTX 2070 SUPER FTW3 ULTRA
42 fps (avg) (44%)
MSI GeForce RTX 2070 SUPER GAMING Z TRIO
42 fps (avg) (44%)
Shadow of the Tomb Raider - 2560x1440 (1440p)
MSI GeForce RTX 3060 GAMING X 12G
80 fps (avg) (51%)
ZOTAC GAMING GeForce RTX 3060 AMP White Edition
80 fps (avg) (51%)
Colorful iGame GeForce RTX 2070 SUPER Advanced OC-V
79 fps (avg) (50%)
ZOTAC GAMING GeForce RTX 3060 Twin Edge
79 fps (avg) (50%)
ZOTAC GAMING GeForce RTX 3060 Twin Edge OC
79 fps (avg) (50%)
Shadow of the Tomb Raider - 1920x1080 (1080p)
GIGABYTE AORUS GeForce RTX 2070 SUPER 8G
118 fps (avg) (59%)
ASUS ROG Strix GeForce RTX 3060 OC Edition
118 fps (avg) (59%)
Colorful iGame GeForce RTX 2070 SUPER Advanced OC-V
117 fps (avg) (58%)
EVGA GeForce RTX 2070 SUPER FTW3 ULTRA
117 fps (avg) (58%)
MSI GeForce RTX 2070 SUPER GAMING Z TRIO
117 fps (avg) (58%)
Crypto-Mining Ethereum Hashrate (MH/s) - Ethash Hashrate
ASUS Dual GeForce RTX 2080 OC
43 MH/s (36%)
ASUS Dual GeForce RTX 2080 OC Evo
43 MH/s (36%)
Colorful iGame GeForce RTX 2070 SUPER Advanced OC-V
42 MH/s (35%)
ASUS ROG Strix GeForce RTX 2080 SUPER OC White
42 MH/s (35%)
NVIDIA GeForce RTX 2080 SUPER Founders Edition
42 MH/s (35%)
Crypto-Mining Ergo Hashrate (MH/s) - Autolykos 2 Hashrate
ASUS Dual GeForce RTX 2080 SUPER OC Evo V2
83 MH/s (31%)
ASUS ROG Strix GeForce RTX 2080 SUPER OC White
83 MH/s (31%)
Colorful iGame GeForce RTX 2070 SUPER Advanced OC-V
82 MH/s (31%)
ASUS Dual GeForce RTX 2080 SUPER Evo V2
82 MH/s (31%)
NVIDIA GeForce RTX 2080 SUPER Founders Edition
82 MH/s (31%)
Crypto-Mining Ravencoin Hashrate (MH/s) - KawPow Hashrate
ASUS ROG Strix GeForce RTX 3060 Ti OC
23 MH/s (47%)
MSI GeForce RTX 3060 Ti Gaming X Trio 8G
23 MH/s (47%)
Colorful iGame GeForce RTX 2070 SUPER Advanced OC-V
22 MH/s (45%)
MSI GeForce RTX 3060 Ti Gaming Trio 8G
22 MH/s (45%)
NVIDIA GeForce RTX 3060 Ti Founders Edition
22 MH/s (45%)
Crypto-Mining Vertcoin Hashrate (MH/s) - Verthash Hashrate
MSI GeForce RTX 2070 ARMOR 8G OC
0.59 MH/s (30%)
ZOTAC GAMING GeForce RTX 2070 AMP
0.59 MH/s (30%)
GIGABYTE GeForce RTX 2070 Windforce 8G (rev. 2.0)
0.58 MH/s (30%)
ASUS Dual GeForce RTX 2070 Mini
0.58 MH/s (30%)
ASUS Dual GeForce RTX 2070 Evo V2
0.58 MH/s (30%)
Beliebter Vergleich
Colorful iGame GeForce RTX 2070 SUPER Advanced OC-V vs
ASUS Dual GeForce RTX 2070 SUPER EVO Advanced
Colorful iGame GeForce RTX 2070 SUPER Advanced OC-V vs
MSI GeForce RTX 2080 Gaming X Trio
ASUS EKWB GeForce RTX 3090 vs
Colorful iGame GeForce RTX 2070 SUPER Advanced OC-V
Colorful iGame GeForce RTX 2070 SUPER Advanced OC-V vs
GIGABYTE AORUS GeForce RTX 3080 Xtreme Waterforce WB 10G
GIGABYTE GeForce RTX 2080 SUPER Windforce OC 8G vs
Colorful iGame GeForce RTX 2070 SUPER Advanced OC-V
Colorful iGame GeForce RTX 2070 SUPER Advanced OC-V vs
Colorful GeForce GTX 1660 SUPER NB 6G-V
Colorful iGame GeForce RTX 2070 SUPER Advanced OC-V vs
Colorful iGame GeForce RTX 3080 Advanced OC 10G-V
Colorful iGame GeForce RTX 2070 SUPER Advanced OC-V vs
GIGABYTE AORUS GeForce RTX 3070 Ti EAGLE OC 8G
GALAX GeForce RTX 2080 EX Gamer (1-Click OC) vs
Colorful iGame GeForce RTX 2070 SUPER Advanced OC-V
Colorful iGame GeForce RTX 2070 SUPER Advanced OC-V vs
AMD Radeon RX 6800 XT
Colorful iGame GeForce RTX 2070 SUPER Advanced OC-V vs
Colorful iGame GeForce RTX 3060 Advanced OC 12G L-V LHR
GIGABYTE GeForce RTX 2080 Gaming 8G vs
Colorful iGame GeForce RTX 2070 SUPER Advanced OC-V
Colorful iGame GeForce RTX 2070 SUPER Advanced OC-V vs
Gainward GeForce RTX 2060 Ghost
PNY GeForce RTX 2080 Ti Blower (Rev. 2.0) vs
Colorful iGame GeForce RTX 2070 SUPER Advanced OC-V
ZOTAC GAMING GeForce GTX 1650 AMP GDDR6 vs
Colorful iGame GeForce RTX 2070 SUPER Advanced OC-V