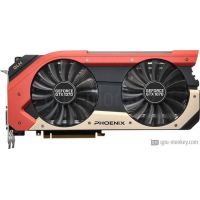
Gainward GeForce GTX 1070 Phoenix GLH
Gainward GeForce GTX 1070 Phoenix GLH hat Q2/2016 gestartet, das auf der NVIDIA GeForce GTX 1070-Architektur basiert. Es wird mit 8 GB von GDDR5-Speicher mit hoher Bandbreite geliefert.Die Gainward GeForce GTX 1070 Phoenix GLH kennzeichnet 1920 - Shader, 64 Ausgabeeinheiten machen, hat eine boost Takt von 1.873 GHz+ 11 % ziehen und der mit einer Leistung ausgestattet 150 W . Die GPU unterstützt bis zu 4 Monitore mit Auflösungen von 7680x4320 . Wenn Sie außerdem nach einem Air cooling -Kühler und einem Axial suchen, ist dies die beste Wahl.
| Based on | NVIDIA GeForce GTX 1070 |
| GPU Chip | GP104-200-A1 |
| Ausführungseinheiten | 15 |
| Shader | 1920 |
| Render Output Units | 64 |
| Texture Units | 120 |
| Memory Size | 8 GB |
| Memory Type | GDDR5 |
| Memory Speed | 2.002 GHz |
| Memory Bandwith | 256 GB/s |
| Memory Interface | 256 bit |
Wo zu kaufen?
Besorgen Gainward GeForce GTX 1070 Phoenix GLH
Clock Speeds
| Base Clock | 1.670 GHz + 11 % + 11 % |
| Boost Clock | 1.873 GHz+ 11 % |
| Avg (Game) Clock | |
| Übertaktung |
Yes |
Thermal Design
| TDP | 150 W |
| TDP (up) | -- |
| Tjunction max | -- |
| PCIe-Power | 1 x 8-Pin |
Cooler & Fans
| Fan-Type | Axial |
| Fan 1 | 2 x 100 mm |
| Fan 2 | -- |
-
| Cooler-Type | Air cooling |
| Noise (Idle) | 0 dB / Silent |
| Noise (Load): | -- |
Connectivity
| Max. Displays | 4 |
| HDCP-Version | 2.2 |
| HDMI Ports | 1x HDMI v2.0b |
| DP Ports | 3x DP v1.4 |
| DVI Ports | 1 |
| VGA Ports | -- |
| USB-C Ports | -- |
Featureset
| Max. resolution | 7680x4320 |
| DirectX | 12_1 |
| Raytracing |
No |
| DLSS / FSR |
No |
| LED | No LED lighting |
Supported Video Codecs
| h264 | Decode / Encode |
| h265 / HEVC | Decode / Encode |
| AV1 |
No |
-
| VP8 | Decode |
| VP9 | Decode |
| Noise (Load): | -- |
Dimensions
| Length | 285 mm |
| Height | 133 mm |
| Width | -- |
| Width (Slots) | 3 PCIe-Slots |
| Weight | -- |
Additional data
| GPU Interface | PCIe 3.0 x 16 |
| Veröffentlichungsdatum | Q2/2016 |
| Release price | -- |
| Structure size | 16 nm |
| Part-no | 426018336-3675 |
FP32 Performance (Single-precision TFLOPS) - FP32 (TFLOPS)
MSI Radeon RX 5600 XT Gaming M
7.2 (18%)
MSI Radeon RX 5600 XT Mech
7.2 (18%)
Gainward GeForce GTX 1070 Phoenix GLH
7.19 (18%)
Palit GeForce GTX 1070 Gamerock Premium
7.19 (18%)
GIGABYTE Radeon RX 590 Gaming 8G
7.19 (18%)
3DMark Benchmark - Time Spy (Performance) Graphics score
GIGABYTE GeForce GTX 1070 Xtreme Gaming 8G
7198 (34%)
Gainward GeForce GTX 1070 Phoenix GLH
7165 (34%)
Palit GeForce GTX 1070 Gamerock Premium
7165 (34%)
ASUS ROG Strix GeForce GTX 1070 OC edition
7148 (34%)
3DMark Benchmark - Fire Strike (Extreme) Graphics score
ASUS AREZ Strix Radeon RX Vega 56 OC Gaming
8545 (29%)
ASUS ROG Strix Radeon RX Vega 56 OC Gaming
8545 (29%)
Gainward GeForce GTX 1070 Phoenix GLH
8515 (29%)
Palit GeForce GTX 1070 Gamerock Premium
8515 (29%)
MSI GeForce GTX 1070 GAMING Z 8G
8494 (29%)
Battlefield 5 - 3840x2160 (2160p)
ASUS ROG Strix GeForce RTX 2060 SUPER EVO Advanced Edition
47 fps (avg) (39%)
ASUS Dual GeForce RTX 2060 SUPER EVO V2 Advanced Edition
47 fps (avg) (39%)
Gainward GeForce GTX 1070 Phoenix GLH
46 fps (avg) (39%)
ASUS Dual GeForce RTX 2060 SUPER EVO V2
46 fps (avg) (39%)
ASUS ROG Strix GeForce RTX 2060 SUPER EVO
46 fps (avg) (39%)
Battlefield 5 - 2560x1440 (1440p)
Colorful iGame GeForce GTX 1070 Ti Vulcan U Top-V
85 fps (avg) (42%)
GIGABYTE GeForce GTX 1070 Xtreme Gaming 8G
83 fps (avg) (41%)
Gainward GeForce GTX 1070 Phoenix GLH
82 fps (avg) (41%)
MSI GeForce GTX 1070 GAMING Z 8G
82 fps (avg) (41%)
ASUS ROG Strix GeForce GTX 1070 OC edition
82 fps (avg) (41%)
Battlefield 5 - 1920x1080 (1080p)
Colorful GeForce GTX 1660 Ti NB 6G-V
103 fps (avg) (51%)
Colorful GeForce GTX 1660 Ti SI 6G-V
103 fps (avg) (51%)
Gainward GeForce GTX 1070 Phoenix GLH
102 fps (avg) (50%)
ASUS ROG Strix GeForce GTX 1070 OC edition
102 fps (avg) (50%)
Palit GeForce GTX 1070 Gamerock Premium
102 fps (avg) (50%)
Shadow of the Tomb Raider - 3840x2160 (2160p)
ASUS ROG Strix GeForce GTX 1660 TI
28 fps (avg) (29%)
ASUS ROG Strix GeForce GTX 1660 TI Advanced
28 fps (avg) (29%)
Gainward GeForce GTX 1070 Phoenix GLH
27 fps (avg) (28%)
ASUS Dual GeForce GTX 1660 SUPER EVO OC
27 fps (avg) (28%)
ASUS TUF Gaming X3 GeForce GTX 1660 SUPER OC
27 fps (avg) (28%)
Shadow of the Tomb Raider - 2560x1440 (1440p)
ASUS Dual GeForce RTX 2060 MINI
53 fps (avg) (34%)
ASUS ROG Strix GeForce RTX 2060 EVO
53 fps (avg) (34%)
Gainward GeForce GTX 1070 Phoenix GLH
52 fps (avg) (33%)
ASUS TUF Gaming X3 GeForce GTX 1660 SUPER OC
52 fps (avg) (33%)
ASUS Dual GeForce GTX 1660 TI EVO
52 fps (avg) (33%)
Shadow of the Tomb Raider - 1920x1080 (1080p)
ASUS Dual GeForce RTX 2060 MINI OC Edition
79 fps (avg) (39%)
ASUS ROG Strix GeForce RTX 2060 EVO Advanced Edition
79 fps (avg) (39%)
Gainward GeForce GTX 1070 Phoenix GLH
78 fps (avg) (39%)
ASUS ROG Strix GeForce RTX 2060 EVO
78 fps (avg) (39%)
ASUS Dual GeForce RTX 2060 MINI
78 fps (avg) (39%)
Crypto-Mining Ethereum Hashrate (MH/s) - Ethash Hashrate
ASUS Turbo GeForce GTX 1070 Ti
29 MH/s (24%)
ASUS ROG Strix GeForce GTX 1070 Ti
29 MH/s (24%)
Gainward GeForce GTX 1070 Phoenix GLH
28 MH/s (23%)
MSI Radeon RX 5500 XT Mech 8G
28 MH/s (23%)
ASRock Radeon RX 5500 XT Challenger D 4G OC
28 MH/s (23%)
Crypto-Mining Ergo Hashrate (MH/s) - Autolykos 2 Hashrate
ASUS TUF Gaming X3 GeForce GTX 1660 SUPER ZAKU II
59 MH/s (22%)
ASUS TUF Gaming X3 GeForce GTX 1660 SUPER
59 MH/s (22%)
Gainward GeForce GTX 1070 Phoenix GLH
58 MH/s (22%)
INNO3D GeForce GTX 1070 iCHILL X3 V2
58 MH/s (22%)
Palit GeForce GTX 1070 Gamerock+
58 MH/s (22%)
Crypto-Mining Ravencoin Hashrate (MH/s) - KawPow Hashrate
ASUS ROG Strix GeForce GTX 1070 Ti Advanced edition
15 MH/s (31%)
Gainward GeForce GTX 1070 Ti Phoenix GS
15 MH/s (31%)
Gainward GeForce GTX 1070 Phoenix GLH
14 MH/s (29%)
ASUS ROG Strix GeForce GTX 1660 TI OC
14 MH/s (29%)
EVGA GeForce GTX 1070 FTW GAMING
14 MH/s (29%)
Crypto-Mining Vertcoin Hashrate (MH/s) - Verthash Hashrate
ASUS Dual GeForce RTX 2060 MINI OC Edition
0.46 MH/s (24%)
ASUS ROG Strix GeForce RTX 2060 EVO Advanced Edition
0.46 MH/s (24%)
Gainward GeForce GTX 1070 Phoenix GLH
0.45 MH/s (23%)
ASUS ROG Strix GeForce GTX 1070 OC edition
0.45 MH/s (23%)
INNO3D GeForce GTX 1070 iCHILL X3 V2
0.45 MH/s (23%)
Beliebter Vergleich
Gainward GeForce GTX 1070 Phoenix GLH vs
Colorful GeForce GTX 1660 NB 6G-V
Gainward GeForce GTX 1070 Phoenix GLH vs
MSI GeForce GTX 1660 ARMOR 6G
Palit GeForce RTX 3090 GamingPro OC vs
Gainward GeForce GTX 1070 Phoenix GLH
Gainward GeForce GTX 1070 Phoenix GLH vs
MSI GeForce RTX 3060 GAMING X Trio 12G
MSI GeForce RTX 3080 SUPRIM SE 10G vs
Gainward GeForce GTX 1070 Phoenix GLH
Gainward GeForce GTX 1070 Phoenix GLH vs
MANLI GeForce RTX 2080Ti (P1467+N504-00)
Gainward GeForce GTX 1070 Phoenix GLH vs
EVGA GeForce RTX 3060 Ti FTW3 Ultra Gaming LHR
Gainward GeForce GTX 1070 Phoenix GLH vs
Colorful GeForce GTX 1060-6G-V
Gainward GeForce GTX 1070 Phoenix vs
Gainward GeForce GTX 1070 Phoenix GLH