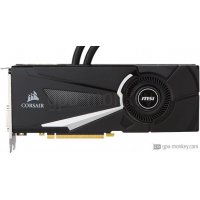
MSI GeForce GTX 1080 SEA HAWK
MSI GeForce GTX 1080 SEA HAWK lanzó Q2/2016, que se basa en la arquitectura NVIDIA GeForce GTX 1080. Vendrá con 8 GB de memoria GDDR5X de gran ancho de banda.El MSI GeForce GTX 1080 SEA HAWK cuenta con 2560 shader, 64 unidades de salida de render, tiene un reloj de impulso de 1.771 GHz+ 2 % y está equipado con un consumo de energía de 180 W . La GPU admite hasta 4 monitores con resoluciones de 7680x4320 . Además, si usted está buscando AIO water cooling más fresco y Axial (Radiator) tipo abanico, que sería su mejor opción.
| Based on | NVIDIA GeForce GTX 1080 |
| GPU Chip | GP104-400-A1 / GP104-410-A1 |
| Unidades de ejecución | 20 |
| Shader | 2560 |
| Render Output Units | 64 |
| Texture Units | 160 |
| Memory Size | 8 GB |
| Memory Type | GDDR5X |
| Memory Speed | 1.251 GHz |
| Memory Bandwith | 320 GB/s |
| Memory Interface | 256 bit |
¿Donde comprar?
Comprar MSI GeForce GTX 1080 SEA HAWK
Clock Speeds
| Base Clock | 1.607 GHz |
| Boost Clock | 1.771 GHz + 2 % + 2 % |
| Avg (Game) Clock | 1.759 GHz |
| Overclocking |
Yes |
Thermal Design
| TDP | 180 W |
| TDP (up) | -- |
| Tjunction max | -- |
| PCIe-Power | 1 x 8-Pin |
Cooler & Fans
| Fan-Type | Axial (Radiator) |
| Fan 1 | 1 x 120 mm |
| Fan 2 | -- |
-
| Cooler-Type | AIO water cooling |
| Noise (Idle) | -- |
| Noise (Load): | -- |
Connectivity
| Max. Displays | 4 |
| HDCP-Version | 2.2 |
| HDMI Ports | 1x HDMI v2.0b |
| DP Ports | 3x DP v1.4 |
| DVI Ports | 1 |
| VGA Ports | -- |
| USB-C Ports | -- |
Featureset
| Max. resolution | 7680x4320 |
| DirectX | 12_1 |
| Raytracing |
No |
| DLSS / FSR |
No |
| LED | No LED lighting |
Supported Video Codecs
| h264 | Decode / Encode |
| h265 / HEVC | Decode / Encode |
| AV1 |
No |
-
| VP8 | Decode |
| VP9 | Decode |
| Noise (Load): | -- |
Dimensions
| Length | 270 mm |
| Height | 111 mm |
| Width | 40 mm |
| Width (Slots) | 2 PCIe-Slots |
| Weight | 1249 g |
Additional data
| GPU Interface | PCIe 3.0 x 16 |
| Fecha de lanzamiento | Q2/2016 |
| Release price | -- |
| Structure size | 16 nm |
| Part-no | -- |
FP32 Performance (Single-precision TFLOPS) - FP32 (TFLOPS)
Palit GeForce GTX 1080 GameRock
9.13 (23%)
MSI GeForce GTX 1080 SEA HAWK
9.07 (23%)
MSI GeForce GTX 1080 AERO 8G OC
9.07 (23%)
MSI GeForce GTX 1080 GAMING+ 8G
9.07 (23%)
3DMark Benchmark - Time Spy (Performance) Graphics score
ASUS TUF Gaming GeForce RTX 2060
7553 (36%)
PowerColor Radeon RX Vega 64 Red Devil
7550 (36%)
MSI GeForce GTX 1080 SEA HAWK
7548 (36%)
GIGABYTE GeForce GTX 1080 Mini ITX 8G
7548 (36%)
MSI GeForce GTX 1080 AERO 8G OC
7548 (36%)
3DMark Benchmark - Fire Strike (Extreme) Graphics score
Palit GeForce GTX 1080 GameRock
9495 (32%)
MSI GeForce GTX 1080 SEA HAWK
9461 (32%)
GIGABYTE GeForce GTX 1080 Mini ITX 8G
9461 (32%)
GIGABYTE GeForce GTX 1080 D5X 8G
9461 (32%)
Battlefield 5 - 3840x2160 (2160p)
GALAX GeForce RTX 2070 EX White (1-Click OC)
53 fps (avg) (45%)
PNY GeForce RTX 2070 XLR8 Gaming Overclocked Edition
53 fps (avg) (45%)
MSI GeForce GTX 1080 SEA HAWK
52 fps (avg) (44%)
EVGA GeForce RTX 2070 BLACK GAMING
52 fps (avg) (44%)
MSI GeForce RTX 2070 AERO 8G
52 fps (avg) (44%)
Battlefield 5 - 2560x1440 (1440p)
MSI Radeon RX 5700 Mech GP
98 fps (avg) (49%)
PNY GeForce RTX 2070 SUPER Dual Fan V1
98 fps (avg) (49%)
MSI GeForce GTX 1080 SEA HAWK
97 fps (avg) (48%)
GIGABYTE GeForce GTX 1080 Turbo OC 8G
97 fps (avg) (48%)
Colorful iGame GeForce GTX 1080 U-TOP-8G-V
97 fps (avg) (48%)
Battlefield 5 - 1920x1080 (1080p)
PowerColor Radeon RX 5600 XT Red Devil
129 fps (avg) (64%)
MANLI GeForce GTX 1080 Hydrosphere
129 fps (avg) (64%)
MSI GeForce GTX 1080 SEA HAWK
128 fps (avg) (63%)
ASUS ROG Strix Radeon RX Vega 56 OC Gaming
128 fps (avg) (63%)
MSI GeForce RTX 2070 ARMOR 8G OCV1
128 fps (avg) (63%)
Shadow of the Tomb Raider - 3840x2160 (2160p)
MSI Radeon RX 5600 XT Gaming X
32 fps (avg) (33%)
ASRock Radeon RX 5600 XT Phantom Gaming D2 6G OC
32 fps (avg) (33%)
MSI GeForce GTX 1080 SEA HAWK
31 fps (avg) (32%)
Palit GeForce GTX 1080 Dual OC
31 fps (avg) (32%)
Sapphire Nitro+ Radeon RX Vega 56 LE
31 fps (avg) (32%)
Shadow of the Tomb Raider - 2560x1440 (1440p)
Palit GeForce RTX 2060 SUPER GP
62 fps (avg) (39%)
MSI GeForce RTX 2060 SUPER VENTUS V1
62 fps (avg) (39%)
MSI GeForce GTX 1080 SEA HAWK
61 fps (avg) (39%)
GIGABYTE Radeon RX Vega 64 Silver 8G
61 fps (avg) (39%)
XFX Radeon RX Vega 64 Silver Fan
61 fps (avg) (39%)
Shadow of the Tomb Raider - 1920x1080 (1080p)
EVGA GeForce GTX 1080 SC2 GAMING
98 fps (avg) (49%)
EVGA GeForce GTX 1080 HYBRID GAMING
98 fps (avg) (49%)
MSI GeForce GTX 1080 SEA HAWK
97 fps (avg) (48%)
ZOTAC GeForce GTX 1080 ArcticStorm Thermaltake 10 Year Anniversary Edition
97 fps (avg) (48%)
ASRock Radeon RX 5600 XT Challenger Pro 6G OC
97 fps (avg) (48%)
Crypto-Mining Ethereum Hashrate (MH/s) - Ethash Hashrate
INNO3D GeForce RTX 2060 SUPER iCHILL X3 Ultra
39 MH/s (32%)
MSI GeForce RTX 2060 SUPER ARMOR OC
39 MH/s (32%)
MSI GeForce GTX 1080 SEA HAWK
38 MH/s (31%)
ASUS ROG Strix GeForce GTX 1080
38 MH/s (31%)
EVGA GeForce GTX 1080 FTW DT GAMING
38 MH/s (31%)
Crypto-Mining Ergo Hashrate (MH/s) - Autolykos 2 Hashrate
EVGA GeForce GTX 1080 FTW HYBRID GAMING
81 MH/s (31%)
EVGA GeForce GTX 1080 SC GAMING ACX
81 MH/s (31%)
MSI GeForce GTX 1080 SEA HAWK
80 MH/s (30%)
GALAX GeForce GTX 1080
80 MH/s (30%)
EVGA GeForce GTX 1080 GAMING
80 MH/s (30%)
Crypto-Mining Ravencoin Hashrate (MH/s) - KawPow Hashrate
ASRock Radeon RX 6600 XT Challenger Pro 8GB OC
17 MH/s (35%)
EVGA GeForce GTX 1080 FTW HYDRO COPPER GAMING
17 MH/s (35%)
MSI GeForce GTX 1080 SEA HAWK
16 MH/s (33%)
MANLI GeForce GTX 1080 Ultimate (F305G+N425)
16 MH/s (33%)
XFX Radeon RX 5700
16 MH/s (33%)
Crypto-Mining Vertcoin Hashrate (MH/s) - Verthash Hashrate
Palit GeForce GTX 1080 GameRock Premium
0.5 MH/s (26%)
EVGA GeForce GTX 1080 HYBRID GAMING
0.5 MH/s (26%)
MSI GeForce GTX 1080 SEA HAWK
0.49 MH/s (25%)
GIGABYTE GeForce GTX 1080 Mini ITX 8G
0.49 MH/s (25%)
GALAX GeForce RTX 3070 EX Gamer (1-Click OC) LHR
0.49 MH/s (25%)