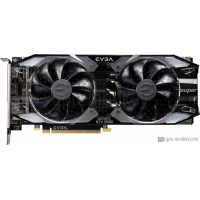
EVGA GeForce RTX 2080 SUPER XC Gaming
EVGA GeForce RTX 2080 SUPER XC Gaming launched Q3/2019, which is based on NVIDIA GeForce RTX 2080 SUPER architecture. It will come with 8 GB of high-bandwidth GDDR6 memory.The EVGA GeForce RTX 2080 SUPER XC Gaming features 3072 shader, 64 render output units, has a boost clock of 1.830 GHz+ 1 % and equipped with a power draw of 250 W. The GPU supports up to 4 monitors with resolutions of 7680x4320. In addition, if you are looking for Air cooling cooler & Axial fan-type, it would be your best choice.
| Based on | NVIDIA GeForce RTX 2080 SUPER |
| GPU Chip | TU104 |
| Execution units | 48 |
| Shader | 3072 |
| Render Output Units | 64 |
| Texture Units | 192 |
| Memory Size | 8 GB |
| Memory Type | GDDR6 |
| Memory Speed | 1.938 GHz |
| Memory Bandwith | 496 GB/s |
| Memory Interface | 256 bit |
Where to Buy?
Buy EVGA GeForce RTX 2080 SUPER XC Gaming
Clock Speeds
| Base Clock | 1.650 GHz |
| Boost Clock | 1.830 GHz + 1 % + 1 % |
| Avg (Game) Clock | 1.815 GHz |
| Overclocking |
Yes |
Thermal Design
| TDP | 250 W |
| TDP (up) | 280 W |
| Tjunction max | -- |
| PCIe-Power | 1 x 6-Pin, 1 x 8-Pin |
Cooler & Fans
| Fan-Type | Axial |
| Fan 1 | 2 x 90 mm |
| Fan 2 | -- |
-
| Cooler-Type | Air cooling |
| Noise (Idle) | 0 dB / Silent |
| Noise (Load): | 45 dB |
Connectivity
| Max. Displays | 4 |
| HDCP-Version | 2.2 |
| HDMI Ports | 1x HDMI v2.0b |
| DP Ports | 3x DP v1.4 |
| DVI Ports | -- |
| VGA Ports | -- |
| USB-C Ports | 1 |
Featureset
| Max. resolution | 7680x4320 |
| DirectX | 12_2 |
| Raytracing |
Yes |
| DLSS / FSR |
Yes |
| LED | No LED lighting |
Supported Video Codecs
| h264 | Decode / Encode |
| h265 / HEVC | Decode / Encode |
| AV1 |
No |
-
| VP8 | Decode |
| VP9 | Decode |
| Noise (Load): | 45 dB |
Dimensions
| Length | 270 mm |
| Height | 111 mm |
| Width | -- |
| Width (Slots) | 2 PCIe-Slots |
| Weight | -- |
Additional data
| GPU Interface | PCIe 3.0 x 16 |
| Release date | Q3/2019 |
| Release price | 829 $ |
| Structure size | 12 nm |
| Part-no | 08G-P4-3182-KR |
FP32 Performance (Single-precision TFLOPS) - FP32 (TFLOPS)
Sapphire Nitro+ Radeon RX Vega 56 LE
11.27 (28%)
ASUS AREZ Strix Radeon RX Vega 56 OC Gaming
11.27 (28%)
EVGA GeForce RTX 2080 SUPER XC Gaming
11.24 (28%)
EVGA GeForce RTX 2080 SUPER XC Hybrid Gaming
11.24 (28%)
MSI GeForce RTX 2080 SUPER Ventus XS OC
11.24 (28%)
3DMark Benchmark - Time Spy (Performance) Graphics score
Gainward GeForce RTX 2080 Phantom GLH
11560 (55%)
Palit GeForce RTX 2080 GameRock Premium
11560 (55%)
EVGA GeForce RTX 2080 SUPER XC Gaming
11536 (55%)
EVGA GeForce RTX 2080 SUPER XC Hybrid Gaming
11536 (55%)
MSI GeForce RTX 2080 SUPER Ventus XS OC
11536 (55%)
3DMark Benchmark - Fire Strike (Extreme) Graphics score
EVGA GeForce RTX 2080 SUPER XC Gaming
13234 (45%)
INNO3D GeForce RTX 2080 SUPER TWIN X2 OC
13234 (45%)
MSI GeForce RTX 2080 SUPER Ventus XS OC
13234 (45%)
Battlefield 5 - 3840x2160 (2160p)
EVGA GeForce RTX 3060 Ti XC Gaming LHR
67 fps (avg) (56%)
ASUS Dual GeForce RTX 3060 Ti OC V2 LHR
67 fps (avg) (56%)
EVGA GeForce RTX 2080 SUPER XC Gaming
66 fps (avg) (55%)
GALAX GeForce RTX 3060 Ti (1-Click OC) LHR
66 fps (avg) (55%)
EVGA GeForce GTX 1080 Ti SC2 ELITE GAMING GREEN
66 fps (avg) (55%)
Battlefield 5 - 2560x1440 (1440p)
KFA2 GeForce RTX 2080 SUPER EX Gamer
119 fps (avg) (59%)
GIGABYTE GeForce RTX 2080 SUPER Gaming OC Waterforce WB 8G
119 fps (avg) (59%)
EVGA GeForce RTX 2080 SUPER XC Gaming
118 fps (avg) (59%)
Gainward GeForce RTX 2080 SUPER Phoenix
118 fps (avg) (59%)
MSI GeForce RTX 2080 SUPER Ventus XS OC
118 fps (avg) (59%)
Battlefield 5 - 1920x1080 (1080p)
KFA2 GeForce RTX 2080 SUPER EX Gamer
163 fps (avg) (81%)
GIGABYTE GeForce RTX 2080 SUPER Gaming OC Waterforce WB 8G
163 fps (avg) (81%)
EVGA GeForce RTX 2080 SUPER XC Gaming
162 fps (avg) (80%)
Gainward GeForce RTX 2080 SUPER Phoenix
162 fps (avg) (80%)
MSI GeForce RTX 2080 SUPER Ventus XS OC
162 fps (avg) (80%)
Shadow of the Tomb Raider - 3840x2160 (2160p)
GIGABYTE GeForce RTX 2080 SUPER Gaming OC Waterforce WB 8G
47 fps (avg) (49%)
KFA2 GeForce RTX 3060 Ti (1-Click OC) LHR
47 fps (avg) (49%)
EVGA GeForce RTX 2080 SUPER XC Gaming
46 fps (avg) (48%)
GALAX GeForce RTX 2080 EX OC Gamer
46 fps (avg) (48%)
EVGA GeForce RTX 2080 FTW3 ULTRA HYBRID GAMING
46 fps (avg) (48%)
Shadow of the Tomb Raider - 2560x1440 (1440p)
ZOTAC Gaming GeForce RTX 3060 Ti Twin Edge OC
91 fps (avg) (58%)
ZOTAC Gaming GeForce RTX 3070 Twin Edge OC LHR
91 fps (avg) (58%)
EVGA GeForce RTX 2080 SUPER XC Gaming
90 fps (avg) (57%)
GIGABYTE GeForce RTX 3070 Eagle 8G
90 fps (avg) (57%)
MANLI GeForce RTX 2080 SUPER (M3423+N502-00)
90 fps (avg) (57%)
Shadow of the Tomb Raider - 1920x1080 (1080p)
ASRock Radeon RX 6700 XT 12GB
128 fps (avg) (64%)
MSI GeForce RTX 2080 Gaming X Trio
128 fps (avg) (64%)
EVGA GeForce RTX 2080 SUPER XC Gaming
127 fps (avg) (63%)
EVGA GeForce RTX 2080 XC2 ULTRA
127 fps (avg) (63%)
EVGA GeForce RTX 2080 SUPER FTW3
127 fps (avg) (63%)
Crypto-Mining Ethereum Hashrate (MH/s) - Ethash Hashrate
MSI GeForce RTX 2080 Sea Hawk X
43 MH/s (36%)
Colorful iGame GeForce RTX 2080 Neptune OC-V
43 MH/s (36%)
EVGA GeForce RTX 2080 SUPER XC Gaming
42 MH/s (35%)
MSI Radeon RX 5600 XT Gaming X
42 MH/s (35%)
EVGA GeForce RTX 2070 SUPER BLACK GAMING
42 MH/s (35%)
Crypto-Mining Ergo Hashrate (MH/s) - Autolykos 2 Hashrate
ASUS ROG Strix GeForce RTX 2080 SUPER OC
83 MH/s (31%)
ASUS ROG Strix GeForce RTX 2060 SUPER EVO V2 OC Edition
83 MH/s (31%)
EVGA GeForce RTX 2080 SUPER XC Gaming
82 MH/s (31%)
PNY GeForce RTX 2070 SUPER Blower
82 MH/s (31%)
ASUS Turbo GeForce RTX 2070 SUPER EVO
82 MH/s (31%)
Crypto-Mining Ravencoin Hashrate (MH/s) - KawPow Hashrate
ZOTAC Gaming GeForce RTX 3070 Twin Edge
29 MH/s (59%)
ASUS ROG Strix GeForce RTX 3070 White V2 LHR
29 MH/s (59%)
EVGA GeForce RTX 2080 SUPER XC Gaming
28 MH/s (57%)
MSI GeForce RTX 2080 SUPER Sea Hawk X
28 MH/s (57%)
KFA2 GeForce RTX 2080 SUPER EX (1-Click OC)
28 MH/s (57%)
Crypto-Mining Vertcoin Hashrate (MH/s) - Verthash Hashrate
EVGA GeForce RTX 2080 XC ULTRA
0.61 MH/s (31%)
GIGABYTE GeForce RTX 2080 Gaming OC 8G
0.61 MH/s (31%)
KFA2 GeForce RTX 2080
0.6 MH/s (31%)
ASUS Dual GeForce RTX 2080 Evo
0.6 MH/s (31%)
ASUS Turbo GeForce RTX 2080 Evo
0.6 MH/s (31%)
Popular Comparision
EVGA GeForce RTX 2080 SUPER XC Gaming vs
EVGA GeForce RTX 3060 XC Gaming
MSI GeForce RTX 3060 Ti Ventus 2X 8G OC vs
EVGA GeForce RTX 2080 SUPER XC Gaming
EVGA GeForce RTX 2080 SUPER XC Gaming vs
EVGA GeForce RTX 3080 XC3 GAMING
XFX Radeon RX 5700 Triple Dissipation vs
EVGA GeForce RTX 2080 SUPER XC Gaming
EVGA GeForce RTX 2080 SUPER XC Gaming vs
ASUS Dual GeForce RTX 2080 Ti Advanced
Gainward GeForce RTX 3060 Ti Ghost OC vs
EVGA GeForce RTX 2080 SUPER XC Gaming
ASUS Dual GeForce RTX 2080 SUPER OC Evo vs
EVGA GeForce RTX 2080 SUPER XC Gaming
EVGA GeForce RTX 2080 SUPER XC Gaming vs
INNO3D GeForce RTX 2070 iCHILL BLACK
INNO3D GeForce RTX 2070 iCHILL X3 JEKYLL vs
EVGA GeForce RTX 2080 SUPER XC Gaming
MSI GeForce RTX 2070 SUPER GAMING X vs
EVGA GeForce RTX 2080 SUPER XC Gaming
EVGA GeForce RTX 2080 SUPER XC Gaming vs
XFX Radeon RX 5700 XT Thicc II Ultra
GIGABYTE AORUS GeForce RTX 2070 SUPER 8G (rev. 2.0) vs
EVGA GeForce RTX 2080 SUPER XC Gaming
ASUS Dual GeForce RTX 2060 vs
EVGA GeForce RTX 2080 SUPER XC Gaming
EVGA GeForce RTX 2080 Ti XC Hybrid Gaming vs
EVGA GeForce RTX 2080 SUPER XC Gaming
EVGA GeForce RTX 3070 FTW3 Ultra Gaming vs
EVGA GeForce RTX 2080 SUPER XC Gaming
EVGA GeForce RTX 2080 SUPER XC Gaming vs
INNO3D GeForce RTX 2080 SUPER iCHILL Frostbite
EVGA GeForce RTX 2080 SUPER XC Gaming vs
GIGABYTE GeForce RTX 2080 SUPER Windforce 8G
MSI GeForce RTX 3060 Ti Gaming X Trio 8G vs
EVGA GeForce RTX 2080 SUPER XC Gaming
ZOTAC GAMING GeForce RTX 3060 Twin Edge OC vs
EVGA GeForce RTX 2080 SUPER XC Gaming
EVGA GeForce RTX 2080 SUPER XC Gaming vs
EVGA GeForce RTX 3060 Ti XC Gaming
EVGA GeForce RTX 2080 SUPER XC Gaming vs
GIGABYTE GeForce GTX 1660 SUPER GAMING 6G