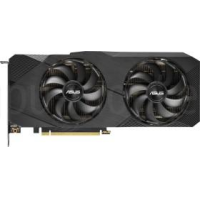
ASUS Dual GeForce RTX 2080 SUPER OC Evo
ASUS Dual GeForce RTX 2080 SUPER OC Evo julkaisi Q3/2019, joka perustuu NVIDIA GeForce RTX 2080 SUPER-arkkitehtuuriin. Sen mukana tulee 8 GB suuren kaistanleveyden GDDR6-muistia.ASUS Dual GeForce RTX 2080 SUPER OC Evo sisältää 3072 Shaderin, 64 renderöintiyksiköitä, sen tehostuskello on 1.860 GHz+ 2 % ja sen tehonkulutus on 250 W . GPU tukee jopa 4 näyttöä, joiden resoluutio on 7680x4320 . Lisäksi, jos etsit Air cooling jäähdytin & Axial fan-tyyppinen, se olisi paras valinta.
| Based on | NVIDIA GeForce RTX 2080 SUPER |
| GPU Chip | TU104 |
| Toteutusyksiköt | 48 |
| Shader | 3072 |
| Render Output Units | 64 |
| Texture Units | 192 |
| Memory Size | 8 GB |
| Memory Type | GDDR6 |
| Memory Speed | 1.938 GHz |
| Memory Bandwith | 496 GB/s |
| Memory Interface | 256 bit |
Mistä ostaa?
Ostaa ASUS Dual GeForce RTX 2080 SUPER OC Evo
Clock Speeds
| Base Clock | 1.650 GHz |
| Boost Clock | 1.860 GHz + 2 % + 2 % |
| Avg (Game) Clock | 1.830 GHz |
| Ylikellotus |
Yes |
Thermal Design
| TDP | 250 W |
| TDP (up) | 280 W |
| Tjunction max | -- |
| PCIe-Power | 2 x 8-Pin |
Cooler & Fans
| Fan-Type | Axial |
| Fan 1 | 2 x 90 mm |
| Fan 2 | -- |
-
| Cooler-Type | Air cooling |
| Noise (Idle) | 0 dB / Silent |
| Noise (Load): | 39 dB |
Connectivity
| Max. Displays | 4 |
| HDCP-Version | 2.2 |
| HDMI Ports | 1x HDMI v2.0b |
| DP Ports | 3x DP v1.4 |
| DVI Ports | -- |
| VGA Ports | -- |
| USB-C Ports | -- |
Featureset
| Max. resolution | 7680x4320 |
| DirectX | 12_2 |
| Raytracing |
Yes |
| DLSS / FSR |
Yes |
| LED | No LED lighting |
Supported Video Codecs
| h264 | Decode / Encode |
| h265 / HEVC | Decode / Encode |
| AV1 |
No |
-
| VP8 | Decode |
| VP9 | Decode |
| Noise (Load): | 39 dB |
Dimensions
| Length | 267 mm |
| Height | 118 mm |
| Width | 56 mm |
| Width (Slots) | 3 PCIe-Slots |
| Weight | -- |
Additional data
| GPU Interface | PCIe 3.0 x 16 |
| Julkaisupäivä | Q3/2019 |
| Release price | 899 $ |
| Structure size | 12 nm |
| Part-no | DUAL-RTX2080S-O8G-EVO |
FP32 Performance (Single-precision TFLOPS) - FP32 (TFLOPS)
MSI GeForce GTX 1080 Ti SEA HAWK
11.61 (29%)
ZOTAC Gaming GeForce RTX 2080 SUPER AMP Extreme
11.52 (29%)
ASUS Dual GeForce RTX 2080 SUPER OC Evo
11.43 (28%)
ASUS Dual GeForce RTX 2080 SUPER OC Evo V2
11.43 (28%)
Palit GeForce RTX 2080 SUPER GRP
11.43 (28%)
3DMark Benchmark - Time Spy (Performance) Graphics score
ZOTAC Gaming GeForce RTX 2080 SUPER AMP Extreme
11675 (56%)
ZOTAC GAMING GeForce RTX 2080 AMP Extreme
11665 (56%)
ASUS Dual GeForce RTX 2080 SUPER OC Evo
11630 (56%)
GALAX GeForce RTX 2080 SUPER EX Gamer Black
11630 (56%)
Palit GeForce RTX 2080 SUPER GRP
11630 (56%)
3DMark Benchmark - Fire Strike (Extreme) Graphics score
Palit GeForce RTX 2080 GameRock Premium
13360 (45%)
Colorful iGame GeForce RTX 2080 Vulcan X OC-V
13360 (45%)
ASUS Dual GeForce RTX 2080 SUPER OC Evo
13347 (45%)
Palit GeForce RTX 2080 SUPER GRP
13347 (45%)
GALAX GeForce RTX 2080 SUPER EX Gamer
13347 (45%)
Battlefield 5 - 3840x2160 (2160p)
MSI GeForce RTX 3060 Ti Gaming Trio Plus 8G LHR
68 fps (avg) (57%)
GIGABYTE GeForce RTX 3060 Ti Gaming OC Pro 8G (Rev. 2.0)
68 fps (avg) (57%)
ASUS Dual GeForce RTX 2080 SUPER OC Evo
67 fps (avg) (56%)
ASUS ROG Strix GeForce RTX 2080 SUPER Advanced
67 fps (avg) (56%)
INNO3D GeForce RTX 3060 Ti iCHILL X3 RED LHR
67 fps (avg) (56%)
Battlefield 5 - 2560x1440 (1440p)
PNY GeForce RTX 3060 Ti Uprising Dual Fan LHR
120 fps (avg) (60%)
INNO3D GeForce RTX 3060 Ti Twin X2 LHR V2
120 fps (avg) (60%)
ASUS Dual GeForce RTX 2080 SUPER OC Evo
119 fps (avg) (59%)
GALAX GeForce RTX 2080 SUPER EX (1-Click OC) PINK Edition
119 fps (avg) (59%)
EVGA GeForce RTX 2080 SUPER FTW3 Hydro Copper Gaming
119 fps (avg) (59%)
Battlefield 5 - 1920x1080 (1080p)
Palit GeForce RTX 3060 Ti Dual V1 LHR
164 fps (avg) (81%)
MSI GeForce RTX 3060 Ti Ventus 2X 8G V1 LHR
164 fps (avg) (81%)
ASUS Dual GeForce RTX 2080 SUPER OC Evo
163 fps (avg) (81%)
GALAX GeForce RTX 2080 SUPER EX (1-Click OC) PINK Edition
163 fps (avg) (81%)
EVGA GeForce RTX 2080 SUPER FTW3 Hydro Copper Gaming
163 fps (avg) (81%)
Shadow of the Tomb Raider - 3840x2160 (2160p)
KFA2 GeForce RTX 3060 Ti EX White (1-Click OC) LHR
48 fps (avg) (50%)
GIGABYTE GeForce RTX 3060 Ti Gaming OC 8G (rev. 2.0) LHR
48 fps (avg) (50%)
ASUS Dual GeForce RTX 2080 SUPER OC Evo
47 fps (avg) (49%)
Palit GeForce RTX 2080 SUPER GRP
47 fps (avg) (49%)
Palit GeForce RTX 3060 Ti GamingPro V1 LHR
47 fps (avg) (49%)
Shadow of the Tomb Raider - 2560x1440 (1440p)
GIGABYTE Radeon RX 6700 XT GAMING OC 12G
92 fps (avg) (58%)
MSI Radeon RX 6700 XT MECH 2X 12G OC
92 fps (avg) (58%)
ASUS Dual GeForce RTX 2080 SUPER OC Evo
91 fps (avg) (58%)
MSI GeForce RTX 3060 Ti Ventus 2X 8G OC
91 fps (avg) (58%)
GALAX GeForce RTX 2080 SUPER EX (1-Click OC) PINK Edition
91 fps (avg) (58%)
Shadow of the Tomb Raider - 1920x1080 (1080p)
GIGABYTE AORUS GeForce RTX 3060 Ti ELITE 8G (rev. 2.0) LHR
129 fps (avg) (64%)
Colorful iGame GeForce RTX 3060 Ti Ultra W OC-V
129 fps (avg) (64%)
ASUS Dual GeForce RTX 2080 SUPER OC Evo
128 fps (avg) (64%)
MSI GeForce RTX 2080 SUPER Sea Hawk X
128 fps (avg) (64%)
ASUS Turbo GeForce RTX 2080 SUPER Evo
128 fps (avg) (64%)
Crypto-Mining Ethereum Hashrate (MH/s) - Ethash Hashrate
GIGABYTE AORUS GeForce RTX 2080 Xtreme Waterforce WB 8G
43 MH/s (36%)
GALAX GeForce RTX 2080 EX OC White
43 MH/s (36%)
ASUS Dual GeForce RTX 2080 SUPER OC Evo
42 MH/s (35%)
Gainward GeForce RTX 2080 Founders
42 MH/s (35%)
EVGA GeForce RTX 2080 SUPER XC Hybrid Gaming
42 MH/s (35%)
Crypto-Mining Ergo Hashrate (MH/s) - Autolykos 2 Hashrate
PowerColor Hellhound Radeon RX 6700 XT
87 MH/s (33%)
ASRock Radeon RX 6700 XT Challenger D 12GB
87 MH/s (33%)
ASUS Dual GeForce RTX 2080 SUPER OC Evo
83 MH/s (31%)
GIGABYTE AORUS GeForce RTX 2070 SUPER 8G
83 MH/s (31%)
Gainward GeForce RTX 2060 SUPER Phantom GS
83 MH/s (31%)
Crypto-Mining Ravencoin Hashrate (MH/s) - KawPow Hashrate
Sapphire Radeon RX 6900 XT
29 MH/s (59%)
Gainward GeForce RTX 3070 Phoenix GS V1 LHR
29 MH/s (59%)
ASUS Dual GeForce RTX 2080 SUPER OC Evo
28 MH/s (57%)
Palit GeForce RTX 2080 GamingPro OC
28 MH/s (57%)
GIGABYTE AORUS GeForce RTX 2080 Xtreme Waterforce 8G
28 MH/s (57%)
Crypto-Mining Vertcoin Hashrate (MH/s) - Verthash Hashrate
EVGA GeForce RTX 2080 XC ULTRA
0.61 MH/s (31%)
GIGABYTE GeForce RTX 2080 Gaming OC 8G
0.61 MH/s (31%)
KFA2 GeForce RTX 2080
0.6 MH/s (31%)
ASUS Dual GeForce RTX 2080 Evo
0.6 MH/s (31%)
ASUS Turbo GeForce RTX 2080 Evo
0.6 MH/s (31%)
Suosittu vertailu
Palit GeForce RTX 3070 JetStream OC vs
ASUS Dual GeForce RTX 2080 SUPER OC Evo
MSI GeForce RTX 2080 SUPER Gaming X Trio vs
ASUS Dual GeForce RTX 2080 SUPER OC Evo
ASUS Dual GeForce RTX 2080 SUPER OC Evo vs
ASUS ROG Strix GeForce RTX 3090 White
ASUS Dual GeForce RTX 2080 SUPER OC Evo vs
MSI GeForce RTX 3070 Ventus 3X 8G OC
ASUS Dual GeForce RTX 2080 SUPER OC Evo vs
EVGA GeForce RTX 2080 SUPER XC Gaming
ASUS Dual GeForce RTX 2080 Ti Advanced vs
ASUS Dual GeForce RTX 2080 SUPER OC Evo
ASUS Dual GeForce RTX 2080 SUPER OC Evo vs
GALAX GeForce RTX 2060 Mini (1-Click OC)
ASUS Dual GeForce RTX 2080 SUPER OC Evo V2 vs
ASUS Dual GeForce RTX 2080 SUPER OC Evo
ASUS Dual GeForce RTX 2080 SUPER OC Evo vs
MSI Radeon RX 5600 XT Mech OC
ASUS ROG Strix GeForce RTX 2080 SUPER vs
ASUS Dual GeForce RTX 2080 SUPER OC Evo
Gainward GeForce RTX 2070 SUPER Phantom GS vs
ASUS Dual GeForce RTX 2080 SUPER OC Evo
ASUS Dual GeForce RTX 2080 SUPER OC Evo vs
MSI GeForce RTX 2080 SUPER Ventus
ASUS Dual GeForce RTX 2080 SUPER OC Evo vs
ASUS TUF Gaming GeForce RTX 3070 Ti OC Edition
Palit GeForce RTX 3070 Ti GamingPro vs
ASUS Dual GeForce RTX 2080 SUPER OC Evo
ASUS Dual GeForce RTX 2080 SUPER OC Evo vs
ASUS Dual GeForce RTX 3070 V2 OC LHR
ASUS ROG Strix GeForce RTX 2080 SUPER OC vs
ASUS Dual GeForce RTX 2080 SUPER OC Evo
GIGABYTE AORUS GeForce RTX 2060 SUPER 8G (rev. 1.0) vs
ASUS Dual GeForce RTX 2080 SUPER OC Evo
Palit GeForce GTX 1660 SUPER GP OC vs
ASUS Dual GeForce RTX 2080 SUPER OC Evo
NVIDIA GeForce RTX 3080 Laptop (Mobile) - 115 W vs
ASUS Dual GeForce RTX 2080 SUPER OC Evo