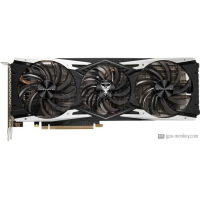
Gainward GeForce RTX 2080 Phoenix
Gainward GeForce RTX 2080 Phoenix julkaisi Q3/2018, joka perustuu NVIDIA GeForce RTX 2080-arkkitehtuuriin. Sen mukana tulee 8 GB suuren kaistanleveyden GDDR6-muistia.Gainward GeForce RTX 2080 Phoenix sisältää 2944 Shaderin, 64 renderöintiyksiköitä, sen tehostuskello on 1.740 GHz+ 2 % ja sen tehonkulutus on 215 W . GPU tukee jopa 4 näyttöä, joiden resoluutio on 7680x4320 . Lisäksi, jos etsit Air cooling jäähdytin & Axial fan-tyyppinen, se olisi paras valinta.
| Based on | NVIDIA GeForce RTX 2080 |
| GPU Chip | TU104 |
| Toteutusyksiköt | 46 |
| Shader | 2944 |
| Render Output Units | 64 |
| Texture Units | 184 |
| Memory Size | 8 GB |
| Memory Type | GDDR6 |
| Memory Speed | 1.75 GHz |
| Memory Bandwith | 448 GB/s |
| Memory Interface | 256 bit |
Mistä ostaa?
Ostaa Gainward GeForce RTX 2080 Phoenix
Clock Speeds
| Base Clock | 1.515 GHz |
| Boost Clock | 1.740 GHz + 2 % + 2 % |
| Avg (Game) Clock | 1.710 GHz |
| Ylikellotus |
Yes |
Thermal Design
| TDP | 215 W |
| TDP (up) | -- |
| Tjunction max | 89 °C |
| PCIe-Power | 1 x 6-Pin, 1 x 8-Pin |
Cooler & Fans
| Fan-Type | Axial |
| Fan 1 | 2 x 90 mm |
| Fan 2 | 1 x 80 mm |
-
| Cooler-Type | Air cooling |
| Noise (Idle) | -- |
| Noise (Load): | -- |
Connectivity
| Max. Displays | 4 |
| HDCP-Version | 2.2 |
| HDMI Ports | 1x HDMI v2.0b |
| DP Ports | 3x DP v1.4a |
| DVI Ports | -- |
| VGA Ports | -- |
| USB-C Ports | 1 |
Featureset
| Max. resolution | 7680x4320 |
| DirectX | 12_2 |
| Raytracing |
Yes |
| DLSS / FSR |
Yes |
| LED | No LED lighting |
Supported Video Codecs
| h264 | Decode / Encode |
| h265 / HEVC | Decode / Encode |
| AV1 |
No |
-
| VP8 | Decode |
| VP9 | Decode |
| Noise (Load): | -- |
Dimensions
| Length | 292 mm |
| Height | 112 mm |
| Width | -- |
| Width (Slots) | 2 PCIe-Slots |
| Weight | -- |
Additional data
| GPU Interface | PCIe 3.0 x 16 |
| Julkaisupäivä | Q3/2018 |
| Release price | -- |
| Structure size | 12 nm |
| Part-no | 426018336-4139 |
FP32 Performance (Single-precision TFLOPS) - FP32 (TFLOPS)
GIGABYTE AORUS Radeon RX 5700 XT 8G
10.29 (26%)
PowerColor Radeon RX 5700 XT Red Devil
10.29 (26%)
Gainward GeForce RTX 2080 Phoenix
10.24 (25%)
ASUS Dual GeForce RTX 2080 Evo
10.24 (25%)
ASUS Turbo GeForce RTX 2080 Evo
10.24 (25%)
3DMark Benchmark - Time Spy (Performance) Graphics score
ASUS Dual GeForce RTX 2080 Advanced Evo
11160 (53%)
PNY GeForce RTX 2080 XLR8 Gaming
11141 (53%)
Gainward GeForce RTX 2080 Phoenix
11106 (53%)
ASUS Dual GeForce RTX 2080 Evo
11106 (53%)
ASUS Turbo GeForce RTX 2080 Evo
11106 (53%)
3DMark Benchmark - Fire Strike (Extreme) Graphics score
NVIDIA GeForce RTX 3080 Laptop (Mobile) - 135 W
12872 (44%)
PNY GeForce RTX 2080 XLR8 Gaming
12858 (44%)
Gainward GeForce RTX 2080 Phoenix
12815 (43%)
ASUS Dual GeForce RTX 2080 Evo
12815 (43%)
ASUS Turbo GeForce RTX 2080 Evo
12815 (43%)
Battlefield 5 - 3840x2160 (2160p)
NVIDIA GeForce RTX 2080 Founders Edition
62 fps (avg) (52%)
ASUS ROG Strix GeForce RTX 2080 Advanced
62 fps (avg) (52%)
Gainward GeForce RTX 2080 Phoenix
61 fps (avg) (51%)
ASUS Dual GeForce RTX 2080 Evo
61 fps (avg) (51%)
ASUS Turbo GeForce RTX 2080 Evo
61 fps (avg) (51%)
Battlefield 5 - 2560x1440 (1440p)
ASUS Dual GeForce RTX 2080 Advanced Evo
113 fps (avg) (56%)
ASUS ROG Strix GeForce RTX 2080 Advanced
113 fps (avg) (56%)
Gainward GeForce RTX 2080 Phoenix
112 fps (avg) (56%)
ASUS Dual GeForce RTX 2080 Evo
112 fps (avg) (56%)
ASUS Turbo GeForce RTX 2080 Evo
112 fps (avg) (56%)
Battlefield 5 - 1920x1080 (1080p)
ASUS ROG Strix GeForce RTX 2080 Advanced
157 fps (avg) (78%)
GIGABYTE GeForce RTX 2080 Turbo OC 8G
157 fps (avg) (78%)
Gainward GeForce RTX 2080 Phoenix
156 fps (avg) (77%)
ASUS Dual GeForce RTX 2080 Evo
156 fps (avg) (77%)
ASUS Turbo GeForce RTX 2080 Evo
156 fps (avg) (77%)
Shadow of the Tomb Raider - 3840x2160 (2160p)
ZOTAC GAMING GeForce RTX 3060 AMP White Edition
45 fps (avg) (47%)
ASUS ROG Strix GeForce RTX 3060 OC Edition
45 fps (avg) (47%)
Gainward GeForce RTX 2080 Phoenix
44 fps (avg) (46%)
MSI GeForce RTX 3060 GAMING X Trio 12G
44 fps (avg) (46%)
MSI GeForce RTX 3060 GAMING X 12G
44 fps (avg) (46%)
Shadow of the Tomb Raider - 2560x1440 (1440p)
GALAX GeForce RTX 2080 SG Edition
84 fps (avg) (53%)
MSI GeForce RTX 2080 Ventus 8G OC
84 fps (avg) (53%)
Gainward GeForce RTX 2080 Phoenix
83 fps (avg) (53%)
ASUS Dual GeForce RTX 2080 Evo
83 fps (avg) (53%)
ASUS Turbo GeForce RTX 2080 Evo
83 fps (avg) (53%)
Shadow of the Tomb Raider - 1920x1080 (1080p)
PNY GeForce RTX 2080 SUPER Blower
127 fps (avg) (63%)
ASUS TUF Gaming GeForce RTX 3060 Ti
127 fps (avg) (63%)
Gainward GeForce RTX 2080 Phoenix
126 fps (avg) (63%)
MSI GeForce RTX 3060 Ti Ventus 3X 8G
126 fps (avg) (63%)
NVIDIA GeForce RTX 3060 Ti Founders Edition
126 fps (avg) (63%)
Crypto-Mining Ethereum Hashrate (MH/s) - Ethash Hashrate
ASUS Dual GeForce RTX 2080 OC Evo
43 MH/s (36%)
ASUS Dual GeForce RTX 2080 OC
43 MH/s (36%)
Gainward GeForce RTX 2080 Phoenix
42 MH/s (35%)
ASUS ROG Strix GeForce RTX 2080 SUPER OC White
42 MH/s (35%)
NVIDIA GeForce RTX 2080 SUPER Founders Edition
42 MH/s (35%)
Crypto-Mining Ergo Hashrate (MH/s) - Autolykos 2 Hashrate
NVIDIA GeForce RTX 2080 Founders Edition
78 MH/s (30%)
ASUS Dual GeForce RTX 2080 OC Evo
78 MH/s (30%)
Gainward GeForce RTX 2080 Phoenix
77 MH/s (29%)
ASUS Turbo GeForce RTX 2080 Evo
77 MH/s (29%)
ASUS Dual GeForce RTX 2070 Evo V2 OC
77 MH/s (29%)
Crypto-Mining Ravencoin Hashrate (MH/s) - KawPow Hashrate
PowerColor Radeon RX 6800
28 MH/s (57%)
EVGA GeForce RTX 2080 SUPER Gaming
28 MH/s (57%)
Gainward GeForce RTX 2080 Phoenix
27 MH/s (55%)
ASUS Turbo GeForce RTX 2080 Evo
27 MH/s (55%)
NVIDIA GeForce RTX 2080 Founders Edition
27 MH/s (55%)
Crypto-Mining Vertcoin Hashrate (MH/s) - Verthash Hashrate
GIGABYTE GeForce RTX 2080 Gaming OC 8G
0.61 MH/s (31%)
EVGA GeForce RTX 2080 XC ULTRA
0.61 MH/s (31%)
Gainward GeForce RTX 2080 Phoenix
0.6 MH/s (31%)
ASUS Dual GeForce RTX 2080 Evo
0.6 MH/s (31%)
ASUS Turbo GeForce RTX 2080 Evo
0.6 MH/s (31%)
Suosittu vertailu
Gainward GeForce RTX 2080 Phoenix vs
Colorful iGame GeForce RTX 3090 Kudan-V
KFA2 GeForce RTX 2060 PLUS (1-Click OC) vs
Gainward GeForce RTX 2080 Phoenix
GIGABYTE AORUS GeForce RTX 2080 SUPER Waterforce 8G vs
Gainward GeForce RTX 2080 Phoenix
PNY GeForce RTX 3090 24GB XLR8 Gaming REVEL EPIC-X RGB vs
Gainward GeForce RTX 2080 Phoenix
NVIDIA GeForce RTX 3080 Laptop (Mobile) - 125 W vs
Gainward GeForce RTX 2080 Phoenix
Gainward GeForce RTX 2080 Phoenix vs
MSI GeForce RTX 3070 Ti GAMING X TRIO 8G