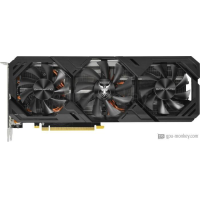
Gainward GeForce RTX 2080 SUPER Phoenix
Gainward GeForce RTX 2080 SUPER Phoenix julkaisi Q3/2019, joka perustuu NVIDIA GeForce RTX 2080 SUPER-arkkitehtuuriin. Sen mukana tulee 8 GB suuren kaistanleveyden GDDR6-muistia.Gainward GeForce RTX 2080 SUPER Phoenix sisältää 3072 Shaderin, 64 renderöintiyksiköitä, sen tehostuskello on 1.815 GHz ja sen tehonkulutus on 250 W . GPU tukee jopa 4 näyttöä, joiden resoluutio on 7680x4320 . Lisäksi, jos etsit Air cooling jäähdytin & Axial fan-tyyppinen, se olisi paras valinta.
| Based on | NVIDIA GeForce RTX 2080 SUPER |
| GPU Chip | TU104 |
| Toteutusyksiköt | 48 |
| Shader | 3072 |
| Render Output Units | 64 |
| Texture Units | 192 |
| Memory Size | 8 GB |
| Memory Type | GDDR6 |
| Memory Speed | 1.938 GHz |
| Memory Bandwith | 496 GB/s |
| Memory Interface | 256 bit |
Mistä ostaa?
Ostaa Gainward GeForce RTX 2080 SUPER Phoenix
Clock Speeds
| Base Clock | 1.650 GHz |
| Boost Clock | 1.815 GHz |
| Avg (Game) Clock | |
| Ylikellotus |
Yes |
Thermal Design
| TDP | 250 W |
| TDP (up) | 280 W |
| Tjunction max | -- |
| PCIe-Power | 1 x 6-Pin, 1 x 8-Pin |
Cooler & Fans
| Fan-Type | Axial |
| Fan 1 | 3 x 80 mm |
| Fan 2 | -- |
-
| Cooler-Type | Air cooling |
| Noise (Idle) | 0 dB / Silent |
| Noise (Load): | 43 dB |
Connectivity
| Max. Displays | 4 |
| HDCP-Version | 2.2 |
| HDMI Ports | 1x HDMI v2.0b |
| DP Ports | 3x DP v1.4 |
| DVI Ports | -- |
| VGA Ports | -- |
| USB-C Ports | -- |
Featureset
| Max. resolution | 7680x4320 |
| DirectX | 12_2 |
| Raytracing |
Yes |
| DLSS / FSR |
Yes |
| LED | No LED lighting |
Supported Video Codecs
| h264 | Decode / Encode |
| h265 / HEVC | Decode / Encode |
| AV1 |
No |
-
| VP8 | Decode |
| VP9 | Decode |
| Noise (Load): | 43 dB |
Dimensions
| Length | 288 mm |
| Height | 112 mm |
| Width | -- |
| Width (Slots) | 3 PCIe-Slots |
| Weight | -- |
Additional data
| GPU Interface | PCIe 3.0 x 16 |
| Julkaisupäivä | Q3/2019 |
| Release price | 759 $ |
| Structure size | 12 nm |
| Part-no | 471056224-1617 |
FP32 Performance (Single-precision TFLOPS) - FP32 (TFLOPS)
MSI GeForce RTX 2080 SUPER Ventus OC
11.24 (28%)
ZOTAC GAMING GeForce RTX 2080 AMP Extreme
11.22 (28%)
Gainward GeForce RTX 2080 SUPER Phoenix
11.15 (28%)
MSI GeForce RTX 2080 SUPER Ventus
11.15 (28%)
Colorful GeForce RTX 2080 SUPER 8G-V
11.15 (28%)
3DMark Benchmark - Time Spy (Performance) Graphics score
GALAX GeForce RTX 2080 EX OC White
11504 (55%)
MSI GeForce RTX 2080 Sea Hawk X
11504 (55%)
Gainward GeForce RTX 2080 SUPER Phoenix
11490 (55%)
MSI GeForce RTX 2080 SUPER Ventus
11490 (55%)
KFA2 GeForce RTX 2080 SUPER
11490 (55%)
3DMark Benchmark - Fire Strike (Extreme) Graphics score
Colorful iGame GeForce GTX 1080 Ti Vulcan X OC-V
13204 (45%)
Gainward GeForce RTX 2080 SUPER Phoenix
13181 (45%)
MSI GeForce RTX 2080 SUPER Ventus
13181 (45%)
MANLI GeForce RTX 2080 SUPER (M1453+N502-00)
13181 (45%)
Battlefield 5 - 3840x2160 (2160p)
KFA2 GeForce RTX 2080 SUPER Work The Frames Edition
67 fps (avg) (56%)
INNO3D GeForce RTX 3060 Ti iCHILL X3 RED
67 fps (avg) (56%)
Gainward GeForce RTX 2080 SUPER Phoenix
66 fps (avg) (55%)
MSI GeForce RTX 2080 SUPER Ventus XS
66 fps (avg) (55%)
Colorful GeForce RTX 3060 Ti NB-V
66 fps (avg) (55%)
Battlefield 5 - 2560x1440 (1440p)
ASUS ROG Strix GeForce RTX 2080 SUPER
119 fps (avg) (59%)
GALAX GeForce RTX 2080 SUPER Work The Frames Edition
119 fps (avg) (59%)
Gainward GeForce RTX 2080 SUPER Phoenix
118 fps (avg) (59%)
GALAX GeForce RTX 2080 SUPER
118 fps (avg) (59%)
Gainward GeForce RTX 2080 SUPER Phantom
118 fps (avg) (59%)
Battlefield 5 - 1920x1080 (1080p)
ASUS ROG Strix GeForce RTX 2080 SUPER
163 fps (avg) (81%)
GALAX GeForce RTX 2080 SUPER Work The Frames Edition
163 fps (avg) (81%)
Gainward GeForce RTX 2080 SUPER Phoenix
162 fps (avg) (80%)
GALAX GeForce RTX 2080 SUPER
162 fps (avg) (80%)
Gainward GeForce RTX 2080 SUPER Phantom
162 fps (avg) (80%)
Shadow of the Tomb Raider - 3840x2160 (2160p)
Colorful iGame GeForce RTX 3060 Ti bilibili E-sports Edition OC LHR-V
47 fps (avg) (49%)
ZOTAC Gaming GeForce RTX 3060 Ti Twin Edge
47 fps (avg) (49%)
Gainward GeForce RTX 2080 SUPER Phoenix
46 fps (avg) (48%)
MANLI GeForce RTX 2080 SUPER (M1453+N502-00)
46 fps (avg) (48%)
Gainward GeForce RTX 2080 SUPER Phantom
46 fps (avg) (48%)
Shadow of the Tomb Raider - 2560x1440 (1440p)
GALAX GeForce RTX 2080 SUPER EX Gamer
91 fps (avg) (58%)
Gainward GeForce RTX 3060 Ti Phoenix V1 LHR
91 fps (avg) (58%)
Gainward GeForce RTX 2080 SUPER Phoenix
90 fps (avg) (57%)
ZOTAC Gaming GeForce RTX 2080 SUPER Triple Fan
90 fps (avg) (57%)
INNO3D GeForce RTX 2080 SUPER JET
90 fps (avg) (57%)
Shadow of the Tomb Raider - 1920x1080 (1080p)
GIGABYTE AORUS GeForce RTX 2080 SUPER Waterforce 8G
128 fps (avg) (64%)
GALAX GeForce RTX 2080 SUPER Work The Frames Edition
128 fps (avg) (64%)
Gainward GeForce RTX 2080 SUPER Phoenix
127 fps (avg) (63%)
INNO3D GeForce RTX 2080 SUPER JET
127 fps (avg) (63%)
Palit GeForce RTX 3060 Ti Dual OC
127 fps (avg) (63%)
Crypto-Mining Ethereum Hashrate (MH/s) - Ethash Hashrate
MSI GeForce RTX 2080 Gaming X Trio
43 MH/s (36%)
Colorful iGame GeForce RTX 2080 Advanced OC V3-V
43 MH/s (36%)
Gainward GeForce RTX 2080 SUPER Phoenix
42 MH/s (35%)
MSI GeForce RTX 2080 SUPER Sea Hawk X
42 MH/s (35%)
Colorful GeForce RTX 2080 SUPER 8G-V
42 MH/s (35%)
Crypto-Mining Ergo Hashrate (MH/s) - Autolykos 2 Hashrate
GIGABYTE AORUS GeForce RTX 2060 SUPER 8G (rev. 1.0)
83 MH/s (31%)
GIGABYTE AORUS GeForce RTX 2070 SUPER 8G
83 MH/s (31%)
Gainward GeForce RTX 2080 SUPER Phoenix
82 MH/s (31%)
GIGABYTE GeForce RTX 2080 SUPER Windforce 8G
82 MH/s (31%)
GALAX GeForce RTX 2060 SUPER ELITE (1-Click OC)
82 MH/s (31%)
Crypto-Mining Ravencoin Hashrate (MH/s) - KawPow Hashrate
Gainward GeForce RTX 3070 Phantom V1 LHR
29 MH/s (59%)
MSI GeForce RTX 3070 Ventus 2X 8G OC LHR
29 MH/s (59%)
Gainward GeForce RTX 2080 SUPER Phoenix
28 MH/s (57%)
XFX Radeon RX 6800
28 MH/s (57%)
MSI GeForce RTX 2080 Gaming X Trio
28 MH/s (57%)
Crypto-Mining Vertcoin Hashrate (MH/s) - Verthash Hashrate
EVGA GeForce RTX 2080 XC ULTRA
0.61 MH/s (31%)
GIGABYTE GeForce RTX 2080 Gaming OC 8G
0.61 MH/s (31%)
KFA2 GeForce RTX 2080
0.6 MH/s (31%)
ASUS Dual GeForce RTX 2080 Evo
0.6 MH/s (31%)
ASUS Turbo GeForce RTX 2080 Evo
0.6 MH/s (31%)
Suosittu vertailu
GIGABYTE GeForce RTX 3070 Gaming OC 8G vs
Gainward GeForce RTX 2080 SUPER Phoenix
MSI GeForce RTX 3060 Ti Gaming Trio 8G vs
Gainward GeForce RTX 2080 SUPER Phoenix
MSI GeForce RTX 3070 Ventus 3X 8G OC vs
Gainward GeForce RTX 2080 SUPER Phoenix
Gainward GeForce RTX 2080 SUPER Phoenix vs
INNO3D GeForce RTX 2060 COMPACT
ASRock Radeon RX 5700 Challenger D 8G OC vs
Gainward GeForce RTX 2080 SUPER Phoenix
Gainward GeForce RTX 2080 SUPER Phoenix vs
Palit GeForce RTX 2060 SUPER JS
Gainward GeForce RTX 2080 SUPER Phoenix vs
INNO3D GeForce RTX 2060 TWIN X2 OC RGB
XFX Radeon RX 580 GTR-S Black Edition 8GB White vs
Gainward GeForce RTX 2080 SUPER Phoenix
Gainward GeForce RTX 2080 SUPER Phoenix vs
GIGABYTE GeForce RTX 3070 Vision OC 8G
Gainward GeForce RTX 2080 SUPER Phoenix vs
XFX Speedster MERC 319 Radeon RX 6700 XT Black Gaming
KFA2 GeForce RTX 2080 SUPER Work The Frames Edition vs
Gainward GeForce RTX 2080 SUPER Phoenix
Gainward GeForce RTX 2080 SUPER Phoenix vs
INNO3D GeForce GTX 1650 GDDR6 COMPACT V2