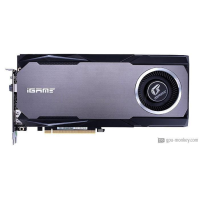
Colorful iGame GeForce RTX 2080 Neptune OC-V
Colorful iGame GeForce RTX 2080 Neptune OC-V a lancé Q3/2018, qui est basé sur l'architecture NVIDIA GeForce RTX 2080. Il sera livré avec 8 GB de mémoire GDDR6 à large bande passante.Le Colorful iGame GeForce RTX 2080 Neptune OC-V comprend un 2944 , des unités de sortie de rendu 64 1.875 GHz+ 10 % et une consommation électrique de 215 W . Le GPU prend en charge jusqu'à 4 moniteurs avec des résolutions de 7680x4320 . De plus, si vous cherchez AIO water cooling plus fraîche et Radial / Axial type de ventilateur, il serait votre meilleur choix.
| Based on | NVIDIA GeForce RTX 2080 |
| GPU Chip | TU104 |
| Unités d'exécution | 46 |
| Ombrage | 2944 |
| Render Output Units | 64 |
| Texture Units | 184 |
| Memory Size | 8 GB |
| Memory Type | GDDR6 |
| Memory Speed | 1.75 GHz |
| Memory Bandwith | 448 GB/s |
| Memory Interface | 256 bit |
Où acheter?
Acheter Colorful iGame GeForce RTX 2080 Neptune OC-V
Clock Speeds
| Base Clock | 1.515 GHz |
| Boost Clock | 1.875 GHz + 10 % + 10 % |
| Avg (Game) Clock | 1.710 GHz |
| Overclocking |
Yes |
Thermal Design
| TDP | 215 W |
| TDP (up) | -- |
| Tjunction max | 89 °C |
| PCIe-Power | 2 x 8-Pin |
Cooler & Fans
| Fan-Type | Radial / Axial |
| Fan 1 | 1 x 75 mm |
| Fan 2 | 2 x 120 mm |
-
| Cooler-Type | AIO water cooling |
| Noise (Idle) | -- |
| Noise (Load): | -- |
Connectivity
| Max. Displays | 4 |
| HDCP-Version | 2.2 |
| HDMI Ports | 1x HDMI v2.0b |
| DP Ports | 3x DP v1.4a |
| DVI Ports | -- |
| VGA Ports | -- |
| USB-C Ports | 1 |
Featureset
| Max. resolution | 7680x4320 |
| DirectX | 12_2 |
| Raytracing |
Yes |
| DLSS / FSR |
Yes |
| LED | iGame Energy Core |
Supported Video Codecs
| h264 | Decode / Encode |
| h265 / HEVC | Decode / Encode |
| AV1 |
No |
-
| VP8 | Decode |
| VP9 | Decode |
| Noise (Load): | -- |
Dimensions
| Length | 293 mm |
| Height | 147 mm |
| Width | 45 mm |
| Width (Slots) | 2 PCIe-Slots |
| Weight | 2000 g |
Additional data
| GPU Interface | PCIe 3.0 x 16 |
| Date de sortie | Q3/2018 |
| Release price | -- |
| Structure size | 12 nm |
| Part-no | -- |
FP32 Performance (Single-precision TFLOPS) - FP32 (TFLOPS)
ASUS ROG Strix GeForce RTX 2080 OC
11.13 (28%)
Sapphire Nitro+ Radeon RX Vega 56
11.11 (28%)
Colorful iGame GeForce RTX 2080 Neptune OC-V
11.04 (27%)
Palit GeForce RTX 2080 GameRock Premium
11.04 (27%)
Colorful iGame GeForce RTX 2080 Vulcan X OC-V
11.04 (27%)
3DMark Benchmark - Time Spy (Performance) Graphics score
ASUS Dual GeForce RTX 2080 SUPER Evo V2
11588 (55%)
ASUS ROG Strix GeForce RTX 2080 SUPER
11588 (55%)
Colorful iGame GeForce RTX 2080 Neptune OC-V
11560 (55%)
Palit GeForce RTX 2080 GameRock Premium
11560 (55%)
Colorful iGame GeForce RTX 2080 Vulcan X OC-V
11560 (55%)
3DMark Benchmark - Fire Strike (Extreme) Graphics score
GIGABYTE AORUS GeForce RTX 2080 Xtreme 8G
13402 (45%)
ZOTAC Gaming GeForce RTX 2080 SUPER AMP Extreme
13392 (45%)
Colorful iGame GeForce RTX 2080 Neptune OC-V
13360 (45%)
Palit GeForce RTX 2080 GameRock Premium
13360 (45%)
Colorful iGame GeForce RTX 2080 Vulcan X OC-V
13360 (45%)
Battlefield 5 - 3840x2160 (2160p)
Gainward GeForce GTX 1080 Ti GS
65 fps (avg) (55%)
ASUS ROG Strix GeForce GTX 1080 Ti
65 fps (avg) (55%)
Colorful iGame GeForce RTX 2080 Neptune OC-V
64 fps (avg) (54%)
ASUS ROG Strix GeForce RTX 2080 OC
64 fps (avg) (54%)
GIGABYTE AORUS GeForce RTX 2080 Xtreme Waterforce 8G
64 fps (avg) (54%)
Battlefield 5 - 2560x1440 (1440p)
GIGABYTE AORUS GeForce GTX 1080 Ti Xtreme Edition 11G
117 fps (avg) (58%)
GIGABYTE AORUS GeForce GTX 1080 Ti Waterforce WB Xtreme Edition 11G
117 fps (avg) (58%)
Colorful iGame GeForce RTX 2080 Neptune OC-V
116 fps (avg) (58%)
MSI GeForce RTX 2080 Sea Hawk EK X
116 fps (avg) (58%)
MSI GeForce RTX 2080 Sea Hawk X
116 fps (avg) (58%)
Battlefield 5 - 1920x1080 (1080p)
GIGABYTE GeForce RTX 2080 SUPER Gaming 8G (Rev. 1.0)
162 fps (avg) (80%)
NVIDIA GeForce RTX 2080 SUPER Founders Edition
162 fps (avg) (80%)
Colorful iGame GeForce RTX 2080 Neptune OC-V
160 fps (avg) (79%)
ASUS ROG Strix GeForce RTX 2080 OC
160 fps (avg) (79%)
GIGABYTE AORUS GeForce RTX 2080 Xtreme Waterforce 8G
160 fps (avg) (79%)
Shadow of the Tomb Raider - 3840x2160 (2160p)
GIGABYTE GeForce RTX 3060 Ti Gaming OC 8G
48 fps (avg) (50%)
ASUS Dual GeForce RTX 3060 Ti Mini OC V2 LHR
48 fps (avg) (50%)
Colorful iGame GeForce RTX 2080 Neptune OC-V
47 fps (avg) (49%)
NVIDIA GeForce RTX 3060 Ti Founders Edition
47 fps (avg) (49%)
MSI GeForce RTX 3060 Ti Ventus 3X 8G OC
47 fps (avg) (49%)
Shadow of the Tomb Raider - 2560x1440 (1440p)
GIGABYTE GeForce RTX 3070 Eagle 8G (rev. 2.0) LHR
90 fps (avg) (57%)
INNO3D GeForce RTX 2080 SUPER JET
90 fps (avg) (57%)
Colorful iGame GeForce RTX 2080 Neptune OC-V
87 fps (avg) (55%)
ASUS ROG Strix GeForce RTX 2080 OC
87 fps (avg) (55%)
GIGABYTE AORUS GeForce RTX 2080 Xtreme Waterforce 8G
87 fps (avg) (55%)
Shadow of the Tomb Raider - 1920x1080 (1080p)
Colorful iGame GeForce RTX 3060 Ti Vulcan OC-V
130 fps (avg) (65%)
ASUS ROG Strix GeForce RTX 3060 Ti OC V2 LHR
130 fps (avg) (65%)
Colorful iGame GeForce RTX 2080 Neptune OC-V
129 fps (avg) (64%)
MSI GeForce RTX 3060 Ti Gaming X 8G
129 fps (avg) (64%)
ASUS TUF Gaming GeForce RTX 3060 Ti OC
129 fps (avg) (64%)
Crypto-Mining Ethereum Hashrate (MH/s) - Ethash Hashrate
GIGABYTE AORUS GeForce RTX 3070 Ti EAGLE OC 8G
45 MH/s (37%)
Gainward GeForce RTX 3070 Ti Phoenix
45 MH/s (37%)
Colorful iGame GeForce RTX 2080 Neptune OC-V
43 MH/s (36%)
ASUS Dual GeForce RTX 2080 OC Evo
43 MH/s (36%)
ASUS Dual GeForce RTX 2080 OC
43 MH/s (36%)
Crypto-Mining Ergo Hashrate (MH/s) - Autolykos 2 Hashrate
ASUS ROG Strix GeForce GTX 1080
80 MH/s (30%)
ASUS Turbo GeForce GTX 1080
80 MH/s (30%)
Colorful iGame GeForce RTX 2080 Neptune OC-V
79 MH/s (30%)
ASUS ROG Strix GeForce RTX 2080 OC
79 MH/s (30%)
GIGABYTE AORUS GeForce RTX 2080 Xtreme Waterforce 8G
79 MH/s (30%)
Crypto-Mining Ravencoin Hashrate (MH/s) - KawPow Hashrate
ASUS ROG Strix GeForce RTX 3070 White
29 MH/s (59%)
ASUS Dual GeForce RTX 3070 V2 LHR
29 MH/s (59%)
Colorful iGame GeForce RTX 2080 Neptune OC-V
28 MH/s (57%)
GIGABYTE Radeon RX 6800 Gaming OC 16G
28 MH/s (57%)
AMD Radeon RX 6800
28 MH/s (57%)
Crypto-Mining Vertcoin Hashrate (MH/s) - Verthash Hashrate
Gainward GeForce RTX 3080 Phantom V1 LHR
0.65 MH/s (33%)
EVGA GeForce RTX 3080 XC3 Black Gaming LHR
0.65 MH/s (33%)
Colorful iGame GeForce RTX 2080 Neptune OC-V
0.62 MH/s (32%)
ASUS ROG Strix GeForce RTX 2080 OC
0.62 MH/s (32%)
MSI GeForce RTX 2080 Sea Hawk EK X
0.62 MH/s (32%)
Comparaison populaire
MSI GeForce RTX 2080 SUPER Gaming X Trio vs
Colorful iGame GeForce RTX 2080 Neptune OC-V
Sapphire Nitro+ Radeon RX Vega 56 vs
Colorful iGame GeForce RTX 2080 Neptune OC-V
Colorful GeForce RTX 2080 SUPER 8G-V vs
Colorful iGame GeForce RTX 2080 Neptune OC-V
Colorful iGame GeForce RTX 2080 Neptune OC-V vs
ASUS ROG Strix GeForce RTX 3080
Colorful iGame GeForce RTX 2080 Neptune OC-V vs
Palit GeForce RTX 3070 GameRock OC V1 LHR
Colorful iGame GeForce RTX 2080 Neptune OC-V vs
ASUS ROG Strix GeForce GTX 1080 Advanced edition
Colorful iGame GeForce RTX 2080 Neptune OC-V vs
EVGA GeForce GTX 1660 Ti XC ULTRA BLACK GAMING
MSI GeForce RTX 2070 AERO ITX 8G vs
Colorful iGame GeForce RTX 2080 Neptune OC-V
EVGA GeForce RTX 2080 SUPER FTW3 Hybrid Gaming vs
Colorful iGame GeForce RTX 2080 Neptune OC-V
EVGA GeForce GTX 1060 FTW GAMING 3GB vs
Colorful iGame GeForce RTX 2080 Neptune OC-V
GIGABYTE AORUS GeForce GTX 1080 Ti Waterforce Xtreme Edition 11G (rev. 1.0/1.1) vs
Colorful iGame GeForce RTX 2080 Neptune OC-V
Colorful iGame GeForce RTX 2080 Neptune OC-V vs
GIGABYTE GeForce GTX 1080 Ti Gaming OC BLACK 11G
Colorful iGame GeForce RTX 2080 Neptune OC-V vs
Gainward GeForce GTX 1660 TI Pegasus