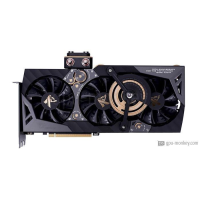
Colorful iGame GeForce RTX 2080 Ti Kudan-V
Colorful iGame GeForce RTX 2080 Ti Kudan-V a lancé Q3/2018, qui est basé sur l'architecture NVIDIA GeForce RTX 2080 Ti. Il sera livré avec 11 GB de mémoire GDDR6 à large bande passante.Le Colorful iGame GeForce RTX 2080 Ti Kudan-V comprend un 4352 , des unités de sortie de rendu 88 1.815 GHz+ 17 % et une consommation électrique de 250 W . Le GPU prend en charge jusqu'à 4 moniteurs avec des résolutions de 7680x4320 . De plus, si vous cherchez AIO water cooling plus fraîche et Axial type de ventilateur, il serait votre meilleur choix.
| Based on | NVIDIA GeForce RTX 2080 Ti |
| GPU Chip | TU102 |
| Unités d'exécution | 68 |
| Ombrage | 4352 |
| Render Output Units | 88 |
| Texture Units | 272 |
| Memory Size | 11 GB |
| Memory Type | GDDR6 |
| Memory Speed | 1.75 GHz |
| Memory Bandwith | 616 GB/s |
| Memory Interface | 352 bit |
Où acheter?
Acheter Colorful iGame GeForce RTX 2080 Ti Kudan-V
Clock Speeds
| Base Clock | 1.350 GHz |
| Boost Clock | 1.815 GHz + 17 % + 17 % |
| Avg (Game) Clock | |
| Overclocking |
Yes |
Thermal Design
| TDP | 250 W |
| TDP (up) | -- |
| Tjunction max | -- |
| PCIe-Power | 3 x 8-Pin |
Cooler & Fans
| Fan-Type | Axial |
| Fan 1 | 2 x 90 mm |
| Fan 2 | 2 x 120 mm |
-
| Cooler-Type | AIO water cooling |
| Noise (Idle) | 0 dB / Silent |
| Noise (Load): | -- |
Connectivity
| Max. Displays | 4 |
| HDCP-Version | 2.2 |
| HDMI Ports | 1x HDMI v2.0b |
| DP Ports | 3x DP v1.4a |
| DVI Ports | -- |
| VGA Ports | -- |
| USB-C Ports | 1 |
Featureset
| Max. resolution | 7680x4320 |
| DirectX | 12_2 |
| Raytracing |
Yes |
| DLSS / FSR |
Yes |
| LED | iGame Energy Core |
Supported Video Codecs
| h264 | Decode / Encode |
| h265 / HEVC | Decode / Encode |
| AV1 |
No |
-
| VP8 | Decode |
| VP9 | Decode |
| Noise (Load): | -- |
Dimensions
| Length | 317 mm |
| Height | 166 mm |
| Width | 62 mm |
| Width (Slots) | 3 PCIe-Slots |
| Weight | 3580 g |
Additional data
| GPU Interface | PCIe 3.0 x 16 |
| Date de sortie | Q3/2018 |
| Release price | -- |
| Structure size | 12 nm |
| Part-no | -- |
FP32 Performance (Single-precision TFLOPS) - FP32 (TFLOPS)
AMD Radeon RX 6800
16.17 (40%)
NVIDIA GeForce RTX 3070 Laptop (Mobile) - 115 W
15.97 (40%)
Colorful iGame GeForce RTX 2080 Ti Kudan-V
15.8 (39%)
ZOTAC GAMING GeForce RTX 2080 Ti AMP Extreme
15.8 (39%)
ASUS ROG Matrix GeForce RTX 2080 Ti Platinum
15.8 (39%)
3DMark Benchmark - Time Spy (Performance) Graphics score
XFX Speedster SWFT 319 Radeon RX 6800 XT CORE
17454 (84%)
GIGABYTE Radeon RX 6800 XT Gaming 16G
17454 (84%)
Colorful iGame GeForce RTX 2080 Ti Kudan-V
15302 (73%)
ZOTAC GAMING GeForce RTX 2080 Ti AMP Extreme
15302 (73%)
ASUS ROG Matrix GeForce RTX 2080 Ti Platinum
15302 (73%)
3DMark Benchmark - Fire Strike (Extreme) Graphics score
Colorful iGame GeForce RTX 3070 Advanced OC-V
17537 (59%)
Palit GeForce RTX 3070 JetStream OC V1 LHR
17537 (59%)
Colorful iGame GeForce RTX 2080 Ti Kudan-V
17526 (59%)
ZOTAC GAMING GeForce RTX 2080 Ti AMP Extreme
17526 (59%)
ASUS ROG Matrix GeForce RTX 2080 Ti Platinum
17526 (59%)
Battlefield 5 - 3840x2160 (2160p)
MSI Radeon RX 6800 Gaming Trio 16G
90 fps (avg) (76%)
XFX Radeon RX 6800
90 fps (avg) (76%)
Colorful iGame GeForce RTX 2080 Ti Kudan-V
86 fps (avg) (72%)
ASUS ROG Strix GeForce RTX 3070 OC White
86 fps (avg) (72%)
ASUS ROG Strix GeForce RTX 3070 OC
86 fps (avg) (72%)
Battlefield 5 - 2560x1440 (1440p)
ASUS TUF Gaming GeForce RTX 3070 OC
143 fps (avg) (71%)
ASUS TUF Gaming GeForce RTX 3070 V2 OC LHR
143 fps (avg) (71%)
Colorful iGame GeForce RTX 2080 Ti Kudan-V
142 fps (avg) (71%)
ASUS ROG Matrix GeForce RTX 2080 Ti Platinum
142 fps (avg) (71%)
MSI GeForce RTX 3070 Gaming X Trio 8G
142 fps (avg) (71%)
Battlefield 5 - 1920x1080 (1080p)
ASUS ROG Strix Radeon RX 6800 OC
194 fps (avg) (96%)
GIGABYTE AORUS Radeon RX 6800 MASTER 16G
194 fps (avg) (96%)
Colorful iGame GeForce RTX 2080 Ti Kudan-V
193 fps (avg) (96%)
ASRock Radeon RX 6800 Challenger Pro 16G OC
193 fps (avg) (96%)
AMD Radeon RX 6800
193 fps (avg) (96%)
Shadow of the Tomb Raider - 3840x2160 (2160p)
GIGABYTE Radeon RX 6800 Gaming 16G
63 fps (avg) (66%)
XFX SPEEDSTER SWFT 319 Radeon RX 6800 CORE
63 fps (avg) (66%)
Colorful iGame GeForce RTX 2080 Ti Kudan-V
62 fps (avg) (65%)
ASUS ROG Matrix GeForce RTX 2080 Ti Platinum
62 fps (avg) (65%)
ASUS ROG Strix GeForce RTX 2080 Ti OC White
62 fps (avg) (65%)
Shadow of the Tomb Raider - 2560x1440 (1440p)
Palit GeForce RTX 3070 Ti GamingPro
122 fps (avg) (77%)
INNO3D GeForce RTX 3070 Ti X3
122 fps (avg) (77%)
Colorful iGame GeForce RTX 2080 Ti Kudan-V
115 fps (avg) (73%)
ZOTAC GAMING GeForce RTX 2080 Ti AMP Extreme
115 fps (avg) (73%)
ASUS ROG Matrix GeForce RTX 2080 Ti Platinum
115 fps (avg) (73%)
Shadow of the Tomb Raider - 1920x1080 (1080p)
GIGABYTE Radeon RX 6800 Gaming 16G
154 fps (avg) (77%)
XFX Radeon RX 6800
154 fps (avg) (77%)
Colorful iGame GeForce RTX 2080 Ti Kudan-V
149 fps (avg) (74%)
ZOTAC GAMING GeForce RTX 2080 Ti AMP Extreme
149 fps (avg) (74%)
ASUS ROG Matrix GeForce RTX 2080 Ti Platinum
149 fps (avg) (74%)
Crypto-Mining Ethereum Hashrate (MH/s) - Ethash Hashrate
MSI GeForce RTX 3060 Ti Gaming X 8G
61 MH/s (50%)
Palit GeForce RTX 3060 Ti Dual
61 MH/s (50%)
Colorful iGame GeForce RTX 2080 Ti Kudan-V
60 MH/s (50%)
ASUS ROG Matrix GeForce RTX 2080 Ti Platinum
60 MH/s (50%)
ASUS ROG Strix GeForce RTX 2080 Ti OC White
60 MH/s (50%)
Crypto-Mining Ergo Hashrate (MH/s) - Autolykos 2 Hashrate
Sapphire Pulse Radeon RX 6800 XT
120 MH/s (45%)
XFX Speedster SWFT 319 Radeon RX 6800 XT CORE
120 MH/s (45%)
Colorful iGame GeForce RTX 2080 Ti Kudan-V
119 MH/s (45%)
ZOTAC GAMING GeForce RTX 2080 Ti AMP Extreme
119 MH/s (45%)
ASUS ROG Matrix GeForce RTX 2080 Ti Platinum
119 MH/s (45%)
Crypto-Mining Ravencoin Hashrate (MH/s) - KawPow Hashrate
EVGA GeForce RTX 3070 Ti XC3 GAMING
38 MH/s (78%)
INNO3D GeForce RTX 3070 Ti X3 OC
38 MH/s (78%)
Colorful iGame GeForce RTX 2080 Ti Kudan-V
34 MH/s (69%)
ASUS ROG Matrix GeForce RTX 2080 Ti Platinum
34 MH/s (69%)
ASUS ROG Strix GeForce RTX 2080 Ti OC White
34 MH/s (69%)
Crypto-Mining Vertcoin Hashrate (MH/s) - Verthash Hashrate
GIGABYTE Radeon RX 6800 XT Gaming 16G
0.94 MH/s (48%)
Sapphire Toxic Radeon RX 6900 XT Extreme Edition
0.9 MH/s (46%)
Colorful iGame GeForce RTX 2080 Ti Kudan-V
0.88 MH/s (45%)
ZOTAC GAMING GeForce RTX 2080 Ti AMP Extreme
0.88 MH/s (45%)
ASUS ROG Matrix GeForce RTX 2080 Ti Platinum
0.88 MH/s (45%)
Comparaison populaire
EVGA GeForce RTX 2070 FTW3 GAMING vs
Colorful iGame GeForce RTX 2080 Ti Kudan-V
GIGABYTE AORUS GeForce RTX 3090 XTREME WATERFORCE WB 24G vs
Colorful iGame GeForce RTX 2080 Ti Kudan-V
Colorful iGame GeForce RTX 2080 Ti Kudan-V vs
Colorful iGame GeForce RTX 3080 Vulcan X OC 10G-V
GIGABYTE GeForce RTX 3090 EAGLE 24G vs
Colorful iGame GeForce RTX 2080 Ti Kudan-V
ASUS ROG Matrix GeForce RTX 2080 Ti Platinum vs
Colorful iGame GeForce RTX 2080 Ti Kudan-V
Colorful iGame GeForce RTX 2080 Ti Kudan-V vs
EVGA GeForce RTX 2070 SUPER XC ULTRA
EVGA GeForce RTX 2070 SUPER XC HYBRID GAMING vs
Colorful iGame GeForce RTX 2080 Ti Kudan-V
MSI GeForce RTX 2070 SUPER GAMING vs
Colorful iGame GeForce RTX 2080 Ti Kudan-V
EVGA GeForce GTX 1050 Ti SC GAMING (Single Fan) vs
Colorful iGame GeForce RTX 2080 Ti Kudan-V
ASUS ROG Strix GeForce RTX 2070 SUPER OC vs
Colorful iGame GeForce RTX 2080 Ti Kudan-V
Palit GeForce RTX 2080 Dual vs
Colorful iGame GeForce RTX 2080 Ti Kudan-V
Colorful iGame GeForce RTX 2080 Ti Kudan-V vs
ASUS Dual GeForce RTX 3060
MSI GeForce GTX 1660 TI ARMOR 6G vs
Colorful iGame GeForce RTX 2080 Ti Kudan-V
PNY GeForce RTX 3060 XLR8 Gaming REVEL EPIC-X RGB Dual Fan Edition vs
Colorful iGame GeForce RTX 2080 Ti Kudan-V