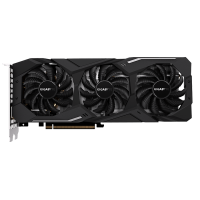
GIGABYTE GeForce RTX 2070 Windforce 8G
GIGABYTE GeForce RTX 2070 Windforce 8G a lancé Q4/2018, qui est basé sur l'architecture NVIDIA GeForce RTX 2070. Il sera livré avec 8 GB de mémoire GDDR6 à large bande passante.Le GIGABYTE GeForce RTX 2070 Windforce 8G comprend un 2304 , des unités de sortie de rendu 64 1.620 GHz et une consommation électrique de 175 W . Le GPU prend en charge jusqu'à 4 moniteurs avec des résolutions de 7680x4320 . De plus, si vous cherchez Air cooling plus fraîche et Axial type de ventilateur, il serait votre meilleur choix.
| Based on | NVIDIA GeForce RTX 2070 |
| GPU Chip | TU106 |
| Unités d'exécution | 36 |
| Ombrage | 2304 |
| Render Output Units | 64 |
| Texture Units | 144 |
| Memory Size | 8 GB |
| Memory Type | GDDR6 |
| Memory Speed | 1.75 GHz |
| Memory Bandwith | 448 GB/s |
| Memory Interface | 256 bit |
Où acheter?
Acheter GIGABYTE GeForce RTX 2070 Windforce 8G
Clock Speeds
| Base Clock | 1.410 GHz |
| Boost Clock | 1.620 GHz |
| Avg (Game) Clock | |
| Overclocking |
Yes |
Thermal Design
| TDP | 175 W |
| TDP (up) | -- |
| Tjunction max | -- |
| PCIe-Power | 1 x 6-Pin, 1 x 8-Pin |
Cooler & Fans
| Fan-Type | Axial |
| Fan 1 | 3 x 80 mm |
| Fan 2 | -- |
-
| Cooler-Type | Air cooling |
| Noise (Idle) | 0 dB / Silent |
| Noise (Load): | -- |
Connectivity
| Max. Displays | 4 |
| HDCP-Version | 2.2 |
| HDMI Ports | 1x HDMI v2.0b |
| DP Ports | 3x DP v1.4a |
| DVI Ports | -- |
| VGA Ports | -- |
| USB-C Ports | 1 |
Featureset
| Max. resolution | 7680x4320 |
| DirectX | 12_2 |
| Raytracing |
Yes |
| DLSS / FSR |
Yes |
| LED | No LED lighting |
Supported Video Codecs
| h264 | Decode / Encode |
| h265 / HEVC | Decode / Encode |
| AV1 |
No |
-
| VP8 | Decode |
| VP9 | Decode |
| Noise (Load): | -- |
Dimensions
| Length | 280 mm |
| Height | 117 mm |
| Width | -- |
| Width (Slots) | 2 PCIe-Slots |
| Weight | -- |
Additional data
| GPU Interface | PCIe 3.0 x 16 |
| Date de sortie | Q4/2018 |
| Release price | -- |
| Structure size | 12 nm |
| Part-no | GV-N2070WF3-8GC |
FP32 Performance (Single-precision TFLOPS) - FP32 (TFLOPS)
MSI Radeon RX 5600 XT Mech OC
7.48 (19%)
MSI Radeon RX 5600 XT Gaming MX
7.48 (19%)
GIGABYTE GeForce RTX 2070 Windforce 8G
7.46 (19%)
GIGABYTE GeForce RTX 2070 MINI ITX 8G V2
7.46 (19%)
3DMark Benchmark - Time Spy (Performance) Graphics score
GIGABYTE GeForce RTX 2070 Windforce 8G
9301 (45%)
MSI GeForce RTX 2070 ARMOR 8G
9301 (45%)
3DMark Benchmark - Fire Strike (Extreme) Graphics score
ASUS Dual GeForce RTX 2070 Mini
11134 (38%)
ASUS Dual GeForce RTX 2070 Evo V2
11134 (38%)
GIGABYTE GeForce RTX 2070 Windforce 8G
11022 (37%)
MSI GeForce RTX 2070 GAMING 8G
11022 (37%)
GIGABYTE GeForce RTX 2070 MINI ITX 8G
11022 (37%)
Battlefield 5 - 3840x2160 (2160p)
ASUS ROG Strix GeForce RTX 2070 Advanced
53 fps (avg) (45%)
ASUS Dual GeForce RTX 2070 Mini OC
53 fps (avg) (45%)
GIGABYTE GeForce RTX 2070 Windforce 8G
52 fps (avg) (44%)
ASUS Dual GeForce RTX 2070 Mini
52 fps (avg) (44%)
ASUS Dual GeForce RTX 2070 Evo V2
52 fps (avg) (44%)
Battlefield 5 - 2560x1440 (1440p)
ASUS ROG Strix GeForce RTX 2070 Advanced
95 fps (avg) (47%)
ASUS Dual GeForce RTX 2070 Mini OC
95 fps (avg) (47%)
GIGABYTE GeForce RTX 2070 Windforce 8G
94 fps (avg) (47%)
ASUS Dual GeForce RTX 2070 Mini
94 fps (avg) (47%)
ASUS Dual GeForce RTX 2070 Evo V2
94 fps (avg) (47%)
Battlefield 5 - 1920x1080 (1080p)
ASUS ROG Strix GeForce RTX 2070 Advanced
127 fps (avg) (63%)
ASUS Dual GeForce RTX 2070 Mini OC
127 fps (avg) (63%)
GIGABYTE GeForce RTX 2070 Windforce 8G
126 fps (avg) (62%)
ASUS Dual GeForce RTX 2070 Mini
126 fps (avg) (62%)
ASUS Dual GeForce RTX 2070 Evo V2
126 fps (avg) (62%)
Shadow of the Tomb Raider - 3840x2160 (2160p)
ASUS ROG Strix GeForce RTX 2070 Advanced
36 fps (avg) (38%)
ASUS Dual GeForce RTX 2070 Mini OC
36 fps (avg) (38%)
GIGABYTE GeForce RTX 2070 Windforce 8G
35 fps (avg) (36%)
ASUS Dual GeForce RTX 2070 Mini
35 fps (avg) (36%)
ASUS Dual GeForce RTX 2070 Evo V2
35 fps (avg) (36%)
Shadow of the Tomb Raider - 2560x1440 (1440p)
ASUS ROG Strix GeForce RTX 2070 Advanced
67 fps (avg) (42%)
ASUS Dual GeForce RTX 2070 Mini OC
67 fps (avg) (42%)
GIGABYTE GeForce RTX 2070 Windforce 8G
66 fps (avg) (42%)
ASUS Dual GeForce RTX 2070 Mini
66 fps (avg) (42%)
ASUS Dual GeForce RTX 2070 Evo V2
66 fps (avg) (42%)
Shadow of the Tomb Raider - 1920x1080 (1080p)
ASUS ROG Strix GeForce RTX 2070 Advanced
96 fps (avg) (48%)
ASUS Dual GeForce RTX 2070 Mini OC
96 fps (avg) (48%)
GIGABYTE GeForce RTX 2070 Windforce 8G
95 fps (avg) (47%)
ASUS Dual GeForce RTX 2070 Mini
95 fps (avg) (47%)
ASUS Dual GeForce RTX 2070 Evo V2
95 fps (avg) (47%)
Crypto-Mining Ethereum Hashrate (MH/s) - Ethash Hashrate
GIGABYTE AORUS GeForce RTX 2070 8G
41 MH/s (34%)
ASUS ROG Strix GeForce RTX 2070 OC
41 MH/s (34%)
GIGABYTE GeForce RTX 2070 Windforce 8G
40 MH/s (33%)
ASUS Dual GeForce RTX 2070 Evo V2
40 MH/s (33%)
ASUS Dual GeForce RTX 2070 Evo V2 OC
40 MH/s (33%)
Crypto-Mining Ergo Hashrate (MH/s) - Autolykos 2 Hashrate
ASUS Turbo GeForce RTX 2080 Evo
77 MH/s (29%)
ASUS Dual GeForce RTX 2070 Evo V2 OC
77 MH/s (29%)
GIGABYTE GeForce RTX 2070 Windforce 8G
76 MH/s (29%)
ASUS Dual GeForce RTX 2070 Mini
76 MH/s (29%)
ASUS Dual GeForce RTX 2070 Evo V2
76 MH/s (29%)
Crypto-Mining Ravencoin Hashrate (MH/s) - KawPow Hashrate
MSI GeForce RTX 3060 Ti Gaming Trio 8G
22 MH/s (45%)
NVIDIA GeForce RTX 3060 Ti Founders Edition
22 MH/s (45%)
GIGABYTE GeForce RTX 2070 Windforce 8G
21 MH/s (43%)
ZOTAC GAMING GeForce RTX 3060 Twin Edge
21 MH/s (43%)
ZOTAC GAMING GeForce RTX 3060 Twin Edge OC
21 MH/s (43%)
Crypto-Mining Vertcoin Hashrate (MH/s) - Verthash Hashrate
MSI GeForce RTX 2070 ARMOR 8G OC
0.59 MH/s (30%)
ZOTAC GAMING GeForce RTX 2070 AMP
0.59 MH/s (30%)
GIGABYTE GeForce RTX 2070 Windforce 8G
0.58 MH/s (30%)
ASUS Dual GeForce RTX 2070 Mini
0.58 MH/s (30%)
ASUS Dual GeForce RTX 2070 Evo V2
0.58 MH/s (30%)
Comparaison populaire
GIGABYTE GeForce RTX 2070 Windforce 8G vs
ZOTAC GAMING GeForce RTX 3060 Twin Edge OC
Gainward GeForce RTX 2060 SUPER Ghost vs
GIGABYTE GeForce RTX 2070 Windforce 8G
GIGABYTE GeForce RTX 2070 Windforce 8G vs
NVIDIA GeForce RTX 2080 Founders Edition
GIGABYTE GeForce RTX 3080 Eagle 10G vs
GIGABYTE GeForce RTX 2070 Windforce 8G
EVGA GeForce RTX 2080 SUPER Black Gaming vs
GIGABYTE GeForce RTX 2070 Windforce 8G
GALAX GeForce RTX 3080 SG (1-Click OC) vs
GIGABYTE GeForce RTX 2070 Windforce 8G
GIGABYTE GeForce RTX 2070 Windforce 8G vs
GALAX GeForce RTX 2060 Mini (1-Click OC)
Gainward GeForce RTX 2070 (3xDP) vs
GIGABYTE GeForce RTX 2070 Windforce 8G
GIGABYTE GeForce RTX 2070 Windforce 8G vs
GALAX GeForce RTX 2060 SUPER
GIGABYTE GeForce RTX 2070 Windforce 8G vs
ASUS Radeon RX Vega 56
ASUS ROG Strix Radeon RX 5700 OC vs
GIGABYTE GeForce RTX 2070 Windforce 8G
GIGABYTE GeForce RTX 2070 Windforce 8G vs
PNY GeForce RTX 2080 Ti XLR8 Gaming Overclocked Edition
GIGABYTE GeForce RTX 2070 Windforce 8G vs
ASUS TUF Gaming GeForce RTX 3060
KFA2 GeForce RTX 3080 SG (1-Click OC) vs
GIGABYTE GeForce RTX 2070 Windforce 8G
GIGABYTE GeForce RTX 2070 Windforce 8G vs
PNY GeForce GTX 1660 SUPER 6GB Single Fan
GIGABYTE GeForce RTX 2070 Windforce 8G vs
GIGABYTE GeForce RTX 3070 Vision OC 8G
ASUS Turbo GeForce RTX 2060 SUPER EVO vs
GIGABYTE GeForce RTX 2070 Windforce 8G
GIGABYTE GeForce RTX 2070 Windforce 8G vs
GALAX GeForce RTX 2060 EX WHITE (1-Click OC)
GIGABYTE GeForce RTX 2070 Windforce 8G vs
Gainward GeForce RTX 3070 Phoenix