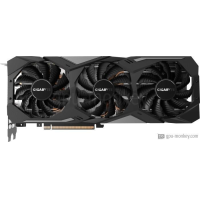
GIGABYTE GeForce RTX 2080 Gaming 8G
GIGABYTE GeForce RTX 2080 Gaming 8G a lancé Q1/2019, qui est basé sur l'architecture NVIDIA GeForce RTX 2080. Il sera livré avec 8 GB de mémoire GDDR6 à large bande passante.Le GIGABYTE GeForce RTX 2080 Gaming 8G comprend un 2944 , des unités de sortie de rendu 64 1.710 GHz et une consommation électrique de 215 W . Le GPU prend en charge jusqu'à 4 moniteurs avec des résolutions de 7680x4320 . De plus, si vous cherchez Air cooling plus fraîche et Axial type de ventilateur, il serait votre meilleur choix.
| Based on | NVIDIA GeForce RTX 2080 |
| GPU Chip | TU104 |
| Unités d'exécution | 46 |
| Ombrage | 2944 |
| Render Output Units | 64 |
| Texture Units | 184 |
| Memory Size | 8 GB |
| Memory Type | GDDR6 |
| Memory Speed | 1.75 GHz |
| Memory Bandwith | 448 GB/s |
| Memory Interface | 256 bit |
Où acheter?
Acheter GIGABYTE GeForce RTX 2080 Gaming 8G
Clock Speeds
| Base Clock | 1.515 GHz |
| Boost Clock | 1.710 GHz |
| Avg (Game) Clock | |
| Overclocking |
Yes |
Thermal Design
| TDP | 215 W |
| TDP (up) | 250 W + 5 % + 5 % |
| Tjunction max | 89 °C |
| PCIe-Power | 1 x 6-Pin, 1 x 8-Pin |
Cooler & Fans
| Fan-Type | Axial |
| Fan 1 | 3 x 80 mm |
| Fan 2 | -- |
-
| Cooler-Type | Air cooling |
| Noise (Idle) | 35 dB |
| Noise (Load): | 45 dB |
Connectivity
| Max. Displays | 4 |
| HDCP-Version | 2.2 |
| HDMI Ports | 1x HDMI v2.0b |
| DP Ports | 3x DP v1.4a |
| DVI Ports | -- |
| VGA Ports | -- |
| USB-C Ports | 1 |
Featureset
| Max. resolution | 7680x4320 |
| DirectX | 12_2 |
| Raytracing |
Yes |
| DLSS / FSR |
Yes |
| LED | GIGABYTE RGB Fusion |
Supported Video Codecs
| h264 | Decode / Encode |
| h265 / HEVC | Decode / Encode |
| AV1 |
No |
-
| VP8 | Decode |
| VP9 | Decode |
| Noise (Load): | 45 dB |
Dimensions
| Length | 287 mm |
| Height | 115 mm |
| Width | 50 mm |
| Width (Slots) | 3 PCIe-Slots |
| Weight | -- |
Additional data
| GPU Interface | PCIe 3.0 x 16 |
| Date de sortie | Q1/2019 |
| Release price | 749 $ |
| Structure size | 12 nm |
| Part-no | GV-N2080GAMING-8GC |
FP32 Performance (Single-precision TFLOPS) - FP32 (TFLOPS)
ASUS Dual Radeon RX 5700 XT OC Evo
10.14 (25%)
MSI Radeon RX 5700 XT Gaming X
10.14 (25%)
GIGABYTE GeForce RTX 2080 Gaming 8G
10.07 (25%)
MSI GeForce RTX 2080 Aero 8G
10.07 (25%)
MSI GeForce RTX 2080 Ventus 8G V2
10.07 (25%)
3DMark Benchmark - Time Spy (Performance) Graphics score
ASUS Turbo GeForce RTX 2080 Evo
11106 (53%)
ASUS Dual GeForce RTX 2080
11077 (53%)
GIGABYTE GeForce RTX 2080 Gaming 8G
11012 (53%)
MSI GeForce RTX 2080 Aero 8G
11012 (53%)
MSI GeForce RTX 2080 Ventus 8G V2
11012 (53%)
3DMark Benchmark - Fire Strike (Extreme) Graphics score
Colorful GeForce GTX 1080 Ti Founders Edition
12759 (43%)
ASUS Turbo GeForce GTX 1080 TI
12759 (43%)
GIGABYTE GeForce RTX 2080 Gaming 8G
12706 (43%)
MSI GeForce RTX 2080 Aero 8G
12706 (43%)
MSI GeForce RTX 2080 Ventus 8G V2
12706 (43%)
Battlefield 5 - 3840x2160 (2160p)
ASUS ROG Strix GeForce RTX 2080 Advanced
62 fps (avg) (52%)
NVIDIA GeForce RTX 2080 Founders Edition
62 fps (avg) (52%)
GIGABYTE GeForce RTX 2080 Gaming 8G
61 fps (avg) (51%)
ASUS Dual GeForce RTX 2080 Evo
61 fps (avg) (51%)
ASUS Turbo GeForce RTX 2080 Evo
61 fps (avg) (51%)
Battlefield 5 - 2560x1440 (1440p)
ASUS ROG Strix GeForce RTX 2080 Advanced
113 fps (avg) (56%)
ASUS Dual GeForce RTX 2080 Advanced Evo
113 fps (avg) (56%)
GIGABYTE GeForce RTX 2080 Gaming 8G
112 fps (avg) (56%)
ASUS Dual GeForce RTX 2080 Evo
112 fps (avg) (56%)
ASUS Turbo GeForce RTX 2080 Evo
112 fps (avg) (56%)
Battlefield 5 - 1920x1080 (1080p)
ASUS Dual GeForce RTX 2080 Evo
156 fps (avg) (77%)
ASUS Turbo GeForce RTX 2080 Evo
156 fps (avg) (77%)
GIGABYTE GeForce RTX 2080 Gaming 8G
155 fps (avg) (77%)
MSI GeForce RTX 2080 Ventus 8G V2
155 fps (avg) (77%)
ASUS Dual GeForce RTX 2080
155 fps (avg) (77%)
Shadow of the Tomb Raider - 3840x2160 (2160p)
ASUS ROG Strix GeForce RTX 3060 OC Edition
45 fps (avg) (47%)
ZOTAC GAMING GeForce RTX 3060 AMP White Edition
45 fps (avg) (47%)
GIGABYTE GeForce RTX 2080 Gaming 8G
44 fps (avg) (46%)
MSI GeForce RTX 3060 GAMING X Trio 12G
44 fps (avg) (46%)
MSI GeForce RTX 3060 GAMING X 12G
44 fps (avg) (46%)
Shadow of the Tomb Raider - 2560x1440 (1440p)
ASUS Dual GeForce RTX 2080 Evo
83 fps (avg) (53%)
ASUS Turbo GeForce RTX 2080 Evo
83 fps (avg) (53%)
GIGABYTE GeForce RTX 2080 Gaming 8G
82 fps (avg) (52%)
ASUS Dual GeForce RTX 2080
82 fps (avg) (52%)
ASUS ROG Strix GeForce RTX 3060 OC Edition
82 fps (avg) (52%)
Shadow of the Tomb Raider - 1920x1080 (1080p)
MSI GeForce RTX 3060 Ti Ventus 3X 8G
126 fps (avg) (63%)
NVIDIA GeForce RTX 3060 Ti Founders Edition
126 fps (avg) (63%)
GIGABYTE GeForce RTX 2080 Gaming 8G
125 fps (avg) (62%)
MSI GeForce RTX 2080 Ventus 8G V2
125 fps (avg) (62%)
ASUS Dual GeForce RTX 2080
125 fps (avg) (62%)
Crypto-Mining Ethereum Hashrate (MH/s) - Ethash Hashrate
ASUS Dual GeForce RTX 2080 OC
43 MH/s (36%)
ASUS Dual GeForce RTX 2080 OC Evo
43 MH/s (36%)
GIGABYTE GeForce RTX 2080 Gaming 8G
42 MH/s (35%)
ASUS ROG Strix GeForce RTX 2080 SUPER OC White
42 MH/s (35%)
NVIDIA GeForce RTX 2080 SUPER Founders Edition
42 MH/s (35%)
Crypto-Mining Ergo Hashrate (MH/s) - Autolykos 2 Hashrate
ASUS Dual GeForce RTX 2080 OC Evo
78 MH/s (30%)
NVIDIA GeForce RTX 2080 Founders Edition
78 MH/s (30%)
GIGABYTE GeForce RTX 2080 Gaming 8G
77 MH/s (29%)
ASUS Turbo GeForce RTX 2080 Evo
77 MH/s (29%)
ASUS Dual GeForce RTX 2070 Evo V2 OC
77 MH/s (29%)
Crypto-Mining Ravencoin Hashrate (MH/s) - KawPow Hashrate
EVGA GeForce RTX 2080 SUPER Gaming
28 MH/s (57%)
PowerColor Radeon RX 6800
28 MH/s (57%)
GIGABYTE GeForce RTX 2080 Gaming 8G
27 MH/s (55%)
ASUS Turbo GeForce RTX 2080 Evo
27 MH/s (55%)
NVIDIA GeForce RTX 2080 Founders Edition
27 MH/s (55%)
Crypto-Mining Vertcoin Hashrate (MH/s) - Verthash Hashrate
EVGA GeForce RTX 2080 XC ULTRA
0.61 MH/s (31%)
GIGABYTE GeForce RTX 2080 Gaming OC 8G
0.61 MH/s (31%)
GIGABYTE GeForce RTX 2080 Gaming 8G
0.6 MH/s (31%)
ASUS Dual GeForce RTX 2080 Evo
0.6 MH/s (31%)
ASUS Turbo GeForce RTX 2080 Evo
0.6 MH/s (31%)
Comparaison populaire
GIGABYTE GeForce RTX 2080 Gaming 8G vs
EVGA GeForce RTX 2080 FTW3
MSI GeForce RTX 2070 AERO ITX 8G vs
GIGABYTE GeForce RTX 2080 Gaming 8G
GIGABYTE GeForce RTX 2080 Gaming 8G vs
ASUS Dual GeForce RTX 3060 Ti Mini
MSI GeForce RTX 2080 SUPER Aero vs
GIGABYTE GeForce RTX 2080 Gaming 8G
GIGABYTE GeForce RTX 2080 Gaming 8G vs
EVGA GeForce RTX 2070 XC BLACK GAMING
GIGABYTE Radeon RX 5600 XT Windforce 6G vs
GIGABYTE GeForce RTX 2080 Gaming 8G
GIGABYTE GeForce RTX 2080 Gaming 8G vs
GIGABYTE GeForce RTX 2080 Ti Windforce OC 11G
Gainward GeForce RTX 2060 SUPER Phantom GS vs
GIGABYTE GeForce RTX 2080 Gaming 8G
GIGABYTE GeForce RTX 2080 Gaming 8G vs
GIGABYTE GeForce GTX 1660 SUPER D6 6G
GIGABYTE GeForce RTX 2080 Gaming 8G vs
GIGABYTE AORUS GeForce RTX 3060 Ti ELITE 8G
GIGABYTE GeForce RTX 2080 Gaming 8G vs
GIGABYTE AORUS GeForce RTX 3060 Elite 12G
Colorful iGame GeForce GTX 1660 SUPER Ultra 6G-V vs
GIGABYTE GeForce RTX 2080 Gaming 8G
GIGABYTE GeForce RTX 2080 Gaming 8G vs
Colorful iGame GeForce RTX 2070 SUPER Advanced OC-V
PNY GeForce GTX 1660 6GB XLR8 Gaming OC Dual Fan vs
GIGABYTE GeForce RTX 2080 Gaming 8G
MSI GeForce GTX 1070 GAMING X 8G vs
GIGABYTE GeForce RTX 2080 Gaming 8G
GIGABYTE GeForce RTX 2080 Gaming 8G vs
EVGA GeForce GTX 1080 SC GAMING ACX
GIGABYTE GeForce RTX 2080 Gaming 8G vs
Colorful iGame GeForce RTX 2070 SUPER Vulcan OC-V
GIGABYTE GeForce RTX 2080 Gaming 8G vs
GIGABYTE Radeon RX 6600 XT Eagle 8G