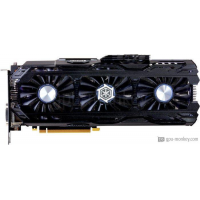
INNO3D GeForce GTX 1080 Ti iCHILL X4 Ultra
gpu_short_descriptiongpu_detail_description
| Based on | NVIDIA GeForce GTX 1080 Ti |
| GPU Chip | GP102-350-K1-A1 |
| निष्पादन इकाइयाँ | 28 |
| शेडर | 3584 |
| Render Output Units | 88 |
| Texture Units | 224 |
| Memory Size | 11 GB |
| Memory Type | GDDR5X |
| Memory Speed | 1.425 GHz |
| Memory Bandwith | 501 GB/s |
| Memory Interface | 352 bit |
कहां खरीदें?
खरीद INNO3D GeForce GTX 1080 Ti iCHILL X4 Ultra
Clock Speeds
| Base Clock | 1.607 GHz + 9 % + 9 % |
| Boost Clock | 1.721 GHz+ 9 % |
| Avg (Game) Clock | |
| overclocking |
Yes |
Thermal Design
| तेदेपा | 280 W+ 12 % |
| TDP (up) | -- |
| Tjunction max | -- |
| PCIe-Power | 1 x 6-Pin, 1 x 8-Pin |
Cooler & Fans
| Fan-Type | Axial |
| Fan 1 | 3 x 90 mm |
| Fan 2 | 1 x 50 mm |
-
| Cooler-Type | Air cooling |
| Noise (Idle) | 0 dB / Silent |
| Noise (Load): | -- |
Connectivity
| Max. Displays | 4 |
| HDCP-Version | 2.2 |
| HDMI Ports | 1x HDMI v2.0b |
| DP Ports | 3x DP v1.4 |
| DVI Ports | 1 |
| VGA Ports | -- |
| USB-C Ports | -- |
Featureset
| Max. resolution | 7680x4320 |
| DirectX | 12_1 |
| Raytracing |
No |
| DLSS / FSR |
No |
| LED | ASUS Aura Sync, GIGABYTE RGB Fusion, MSI Mystic Light |
Supported Video Codecs
| h264 | Decode / Encode |
| h265 / HEVC | Decode / Encode |
| AV1 |
No |
-
| VP8 | Decode |
| VP9 | Decode |
| Noise (Load): | -- |
Dimensions
| Length | 302 mm |
| Height | 115 mm |
| Width | -- |
| Width (Slots) | 3 PCIe-Slots |
| Weight | -- |
Additional data
| GPU Interface | PCIe 3.0 x 16 |
| रिलीज़ की तारीख | Q1/2017 |
| Release price | -- |
| Structure size | 16 nm |
| Part-no | C108T4-1SDN-Q6MNX |
FP32 Performance (Single-precision TFLOPS) - FP32 (TFLOPS)
INNO3D GeForce GTX 1080 Ti iCHILL X4 Ultra
12.34 (31%)
INNO3D GeForce GTX 1080 Ti iCHILL X3 Ultra
12.34 (31%)
INNO3D GeForce GTX 1080 Ti iCHILL Black
12.34 (31%)
3DMark Benchmark - Time Spy (Performance) Graphics score
NVIDIA GeForce RTX 3080 Laptop (Mobile) - 125 W
10211 (49%)
INNO3D GeForce GTX 1080 Ti iCHILL X4 Ultra
10208 (49%)
INNO3D GeForce GTX 1080 Ti iCHILL X3 Ultra
10208 (49%)
INNO3D GeForce GTX 1080 Ti iCHILL Black
10208 (49%)
3DMark Benchmark - Fire Strike (Extreme) Graphics score
MSI GeForce RTX 2080 SUPER Ventus
13181 (45%)
INNO3D GeForce GTX 1080 Ti iCHILL X4 Ultra
13171 (45%)
INNO3D GeForce GTX 1080 Ti iCHILL X3 Ultra
13171 (45%)
INNO3D GeForce GTX 1080 Ti iCHILL Black
13171 (45%)
Battlefield 5 - 3840x2160 (2160p)
GIGABYTE AORUS GeForce GTX 1080 Ti Xtreme Edition 11G
68 fps (avg) (57%)
ASUS ROG Strix GeForce RTX 2080 SUPER OC
68 fps (avg) (57%)
INNO3D GeForce GTX 1080 Ti iCHILL X4 Ultra
67 fps (avg) (56%)
MSI GeForce RTX 3060 Ti Ventus 2X 8G OCV1
67 fps (avg) (56%)
MSI GeForce RTX 3060 Ti Ventus 3X 8G OC
67 fps (avg) (56%)
Battlefield 5 - 2560x1440 (1440p)
GIGABYTE AORUS GeForce GTX 1080 Ti Xtreme Edition 11G
117 fps (avg) (58%)
GIGABYTE AORUS GeForce GTX 1080 Ti Waterforce WB Xtreme Edition 11G
117 fps (avg) (58%)
INNO3D GeForce GTX 1080 Ti iCHILL X4 Ultra
116 fps (avg) (58%)
MSI GeForce RTX 2080 Sea Hawk X
116 fps (avg) (58%)
MSI GeForce RTX 2080 Sea Hawk EK X
116 fps (avg) (58%)
Battlefield 5 - 1920x1080 (1080p)
Colorful iGame GeForce GTX 1080 Ti Vulcan X OC-V
149 fps (avg) (74%)
ASUS ROG Poseidon GeForce GTX 1080 Ti Platinum edition
149 fps (avg) (74%)
INNO3D GeForce GTX 1080 Ti iCHILL X4 Ultra
148 fps (avg) (73%)
Colorful iGame GeForce GTX 1080 Ti Vulcan AD-V
148 fps (avg) (73%)
ASUS ROG Strix GeForce GTX 1080 Ti OC edition
148 fps (avg) (73%)
Shadow of the Tomb Raider - 3840x2160 (2160p)
ZOTAC GAMING GeForce RTX 3060 Twin Edge
43 fps (avg) (45%)
ZOTAC GAMING GeForce RTX 3060 Twin Edge OC
43 fps (avg) (45%)
INNO3D GeForce GTX 1080 Ti iCHILL X4 Ultra
42 fps (avg) (44%)
EVGA GeForce RTX 2070 SUPER FTW3 ULTRA
42 fps (avg) (44%)
MSI GeForce RTX 2070 SUPER GAMING Z TRIO
42 fps (avg) (44%)
Shadow of the Tomb Raider - 2560x1440 (1440p)
ASUS ROG Poseidon GeForce GTX 1080 Ti Platinum edition
76 fps (avg) (48%)
PowerColor Radeon RX 5700 XT Liquid Devil Limited Edition
76 fps (avg) (48%)
INNO3D GeForce GTX 1080 Ti iCHILL X4 Ultra
75 fps (avg) (47%)
ASUS ROG Strix GeForce GTX 1080 Ti OC edition
75 fps (avg) (47%)
ASRock Radeon RX 5700 XT Taichi X 8G OC+
75 fps (avg) (47%)
Shadow of the Tomb Raider - 1920x1080 (1080p)
PowerColor Radeon RX 5700 XT Liquid Devil Limited Edition
110 fps (avg) (55%)
ASUS ROG Strix Radeon RX 5700 XT OC
110 fps (avg) (55%)
INNO3D GeForce GTX 1080 Ti iCHILL X4 Ultra
109 fps (avg) (54%)
ASUS Dual Radeon RX 5700 XT OC Evo
109 fps (avg) (54%)
MSI Radeon RX 5700 XT Gaming X
109 fps (avg) (54%)
Crypto-Mining Ethereum Hashrate (MH/s) - Ethash Hashrate
NVIDIA GeForce RTX 3080 Laptop (Mobile) - 150 W
52 MH/s (43%)
GIGABYTE AORUS GeForce GTX 1080 Ti Xtreme Edition 11G
52 MH/s (43%)
INNO3D GeForce GTX 1080 Ti iCHILL X4 Ultra
51 MH/s (42%)
NVIDIA GeForce RTX 3080 Laptop (Mobile) - 140 W
51 MH/s (42%)
NVIDIA GeForce RTX 3080 Laptop (Mobile) - 135 W
51 MH/s (42%)
Crypto-Mining Ergo Hashrate (MH/s) - Autolykos 2 Hashrate
GIGABYTE AORUS GeForce GTX 1080 Ti Xtreme Edition 11G
101 MH/s (38%)
INNO3D GeForce GTX 1080 Ti iCHILL X4 Ultra
100 MH/s (38%)
ASUS ROG Poseidon GeForce GTX 1080 Ti Platinum edition
100 MH/s (38%)
ASUS ROG Strix GeForce GTX 1080 Ti OC edition
100 MH/s (38%)
Crypto-Mining Ravencoin Hashrate (MH/s) - KawPow Hashrate
MSI GeForce RTX 2080 Ventus 8G V2
27 MH/s (55%)
Palit GeForce RTX 2080 GamingPro
27 MH/s (55%)
INNO3D GeForce GTX 1080 Ti iCHILL X4 Ultra
26 MH/s (53%)
ASUS ROG Poseidon GeForce GTX 1080 Ti Platinum edition
26 MH/s (53%)
ASUS ROG Strix GeForce GTX 1080 Ti OC edition
26 MH/s (53%)
Crypto-Mining Vertcoin Hashrate (MH/s) - Verthash Hashrate
ZOTAC GeForce GTX 1080 Ti AMP Extreme
0.84 MH/s (43%)
INNO3D GeForce GTX 1080 Ti iCHILL X4 Ultra
0.83 MH/s (43%)
Colorful iGame GeForce GTX 1080 Ti Vulcan X OC-V
0.83 MH/s (43%)
ASUS ROG Poseidon GeForce GTX 1080 Ti Platinum edition
0.83 MH/s (43%)