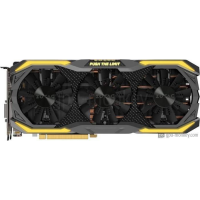
ZOTAC GeForce GTX 1070 Ti AMP Extreme
gpu_short_descriptiongpu_detail_description
| Based on | NVIDIA GeForce GTX 1070 Ti |
| GPU Chip | GP104-300-A1 |
| निष्पादन इकाइयाँ | 199 |
| शेडर | 2432 |
| Render Output Units | 64 |
| Texture Units | 152 |
| Memory Size | 8 GB |
| Memory Type | GDDR5 |
| Memory Speed | 2.002 GHz |
| Memory Bandwith | 256 GB/s |
| Memory Interface | 256 bit |
कहां खरीदें?
खरीद ZOTAC GeForce GTX 1070 Ti AMP Extreme
Clock Speeds
| Base Clock | 1.607 GHz |
| Boost Clock | 1.683 GHz |
| Avg (Game) Clock | |
| overclocking |
Yes |
Thermal Design
| तेदेपा | 180 W |
| TDP (up) | -- |
| Tjunction max | -- |
| PCIe-Power | 2 x 8-Pin |
Cooler & Fans
| Fan-Type | Axial |
| Fan 1 | 3 x 90 mm |
| Fan 2 | -- |
-
| Cooler-Type | Air cooling |
| Noise (Idle) | -- |
| Noise (Load): | -- |
Connectivity
| Max. Displays | 4 |
| HDCP-Version | 2.2 |
| HDMI Ports | 1x HDMI v2.0b |
| DP Ports | 3x DP v1.4 |
| DVI Ports | 1 |
| VGA Ports | -- |
| USB-C Ports | -- |
Featureset
| Max. resolution | 7680x4320 |
| DirectX | 12_1 |
| Raytracing |
No |
| DLSS / FSR |
No |
| LED | ZOTAC SPECTRA |
Supported Video Codecs
| h264 | Decode / Encode |
| h265 / HEVC | Decode / Encode |
| AV1 |
No |
-
| VP8 | Decode |
| VP9 | Decode |
| Noise (Load): | -- |
Dimensions
| Length | 325 mm |
| Height | 148 mm |
| Width | 57 mm |
| Width (Slots) | 3 PCIe-Slots |
| Weight | -- |
Additional data
| GPU Interface | PCIe 3.0 x 16 |
| रिलीज़ की तारीख | Q4/2017 |
| Release price | -- |
| Structure size | 16 nm |
| Part-no | ZT-P10710B-10P |
FP32 Performance (Single-precision TFLOPS) - FP32 (TFLOPS)
Palit GeForce RTX 2070 GameRock Premium
8.36 (21%)
KFA2 GeForce RTX 2070 OC
8.36 (21%)
ZOTAC GeForce GTX 1070 Ti AMP Extreme
8.19 (20%)
INNO3D GeForce GTX 1070 Ti iCHILL X4
8.19 (20%)
3DMark Benchmark - Time Spy (Performance) Graphics score
ASUS Turbo GeForce GTX 1070 Ti
7279 (35%)
ZOTAC GeForce GTX 1070 Ti AMP Extreme
7200 (34%)
MSI GeForce GTX 1070 TI AERO 8G
7200 (34%)
3DMark Benchmark - Fire Strike (Extreme) Graphics score
GIGABYTE AORUS GeForce GTX 1070Ti Gaming 8G
8909 (30%)
ZOTAC GeForce GTX 1070 Ti AMP Extreme
8812 (30%)
MANLI GeForce GTX 1070Ti (F379G+N424)
8812 (30%)
Battlefield 5 - 3840x2160 (2160p)
KFA2 GeForce RTX 2060 SUPER Gamer (1-Click OC)
47 fps (avg) (39%)
PNY GeForce RTX 2060 SUPER 8GB XLR8 Gaming Overclocked Edition Dual Fan
47 fps (avg) (39%)
ZOTAC GeForce GTX 1070 Ti AMP Extreme
46 fps (avg) (39%)
MSI GeForce RTX 2060 SUPER AERO ITX
46 fps (avg) (39%)
GIGABYTE GeForce RTX 2060 SUPER GAMING 3X WHITE 8G (rev. 1.0)
46 fps (avg) (39%)
Battlefield 5 - 2560x1440 (1440p)
ASUS Turbo GeForce GTX 1070 Ti
86 fps (avg) (43%)
GIGABYTE AORUS GeForce GTX 1070Ti WINDFORCE 8G
86 fps (avg) (43%)
ZOTAC GeForce GTX 1070 Ti AMP Extreme
85 fps (avg) (42%)
MSI GeForce GTX 1070 Ti DUKE 8G
85 fps (avg) (42%)
ZOTAC GeForce GTX 1070 Ti OEM
85 fps (avg) (42%)
Battlefield 5 - 1920x1080 (1080p)
ASUS ROG Strix GeForce GTX 1070 Ti
112 fps (avg) (55%)
GIGABYTE AORUS GeForce GTX 1070Ti Gaming 8G
112 fps (avg) (55%)
ZOTAC GeForce GTX 1070 Ti AMP Extreme
111 fps (avg) (55%)
Colorful iGame GeForce GTX 1070 Ti Vulcan U Top-V
111 fps (avg) (55%)
Palit GeForce RTX 2060 GamingPro OC
111 fps (avg) (55%)
Shadow of the Tomb Raider - 3840x2160 (2160p)
ASRock Radeon RX 5600 XT Challenger Pro 6G OC
32 fps (avg) (33%)
ASUS Turbo GeForce GTX 1070 Ti
32 fps (avg) (33%)
ZOTAC GeForce GTX 1070 Ti AMP Extreme
31 fps (avg) (32%)
Colorful iGame GeForce GTX 1070 Ti Twin-V
31 fps (avg) (32%)
Palit GeForce GTX 1080 Dual OC
31 fps (avg) (32%)
Shadow of the Tomb Raider - 2560x1440 (1440p)
GIGABYTE GeForce GTX 1080 Xtreme Gaming WATERFORCE 8G
64 fps (avg) (41%)
Gainward GeForce RTX 2060 SUPER Phantom GS
64 fps (avg) (41%)
ZOTAC GeForce GTX 1070 Ti AMP Extreme
63 fps (avg) (40%)
Palit GeForce GTX 1070 Ti JetStream
63 fps (avg) (40%)
KFA2 GeForce RTX 2060 SUPER Gamer (1-Click OC)
63 fps (avg) (40%)
Shadow of the Tomb Raider - 1920x1080 (1080p)
ZOTAC GAMING GeForce RTX 2070 AMP Extreme
100 fps (avg) (50%)
ZOTAC GeForce GTX 1080 AMP Extreme
100 fps (avg) (50%)
ZOTAC GeForce GTX 1070 Ti AMP Extreme
99 fps (avg) (49%)
EVGA GeForce GTX 1080 FTW HYDRO COPPER GAMING
99 fps (avg) (49%)
GALAX GeForce GTX 1070 Ti Virtual Edition
99 fps (avg) (49%)
Crypto-Mining Ethereum Hashrate (MH/s) - Ethash Hashrate
KFA2 GeForce RTX 2060
30 MH/s (25%)
ZOTAC GAMING GeForce RTX 2060 Twin Fan
30 MH/s (25%)
ZOTAC GeForce GTX 1070 Ti AMP Extreme
29 MH/s (24%)
KFA2 GeForce GTX 1070 Ti Red Edition
29 MH/s (24%)
MSI GeForce GTX 1070 TI GAMING 8G
29 MH/s (24%)
Crypto-Mining Ergo Hashrate (MH/s) - Autolykos 2 Hashrate
Gainward GeForce GTX 1070 Ti Phoenix GS
73 MH/s (28%)
Palit GeForce GTX 1070 Ti Super JetStream
73 MH/s (28%)
ZOTAC GeForce GTX 1070 Ti AMP Extreme
72 MH/s (27%)
GIGABYTE AORUS GeForce GTX 1070Ti Gaming 8G
72 MH/s (27%)
Gainward GeForce GTX 1070 Ti
72 MH/s (27%)
Crypto-Mining Ravencoin Hashrate (MH/s) - KawPow Hashrate
ASUS ROG Strix GeForce GTX 1070 Ti Advanced edition
15 MH/s (31%)
ASUS Dual Radeon RX 6600
15 MH/s (31%)
ZOTAC GeForce GTX 1070 Ti AMP Extreme
14 MH/s (29%)
PNY GeForce GTX 1070 XLR8 Gaming Overclocked
14 MH/s (29%)
ASUS Dual series GeForce GTX 1070 OC edition
14 MH/s (29%)
Crypto-Mining Vertcoin Hashrate (MH/s) - Verthash Hashrate
ZOTAC GAMING GeForce RTX 2060 AMP
0.46 MH/s (24%)
XFX Radeon RX 580 GTS Black Core Edition 8GB
0.46 MH/s (24%)
ZOTAC GeForce GTX 1070 Ti AMP Extreme
0.45 MH/s (23%)
EVGA GeForce RTX 2060 XC BLACK GAMING
0.45 MH/s (23%)
Colorful iGame GeForce GTX 1070 Vulcan X OC-V
0.45 MH/s (23%)
लोकप्रिय तुलना
ZOTAC GeForce GTX 1070 Ti AMP Extreme vs
GIGAYBYTE GeForce GT 1030 Silent Low Profile 2G
MSI GeForce RTX 3070 Ventus 2X 8G vs
ZOTAC GeForce GTX 1070 Ti AMP Extreme
ZOTAC GeForce GTX 1070 Ti AMP Extreme vs
ASUS Dual GeForce RTX 3060
ZOTAC GeForce GTX 1070 Ti AMP Extreme vs
ASRock Radeon RX 5700 XT Challenger Pro 8G OC
ASUS ROG Strix Radeon RX 590 vs
ZOTAC GeForce GTX 1070 Ti AMP Extreme
GIGABYTE AORUS GeForce RTX 3070 Ti MASTER 8G vs
ZOTAC GeForce GTX 1070 Ti AMP Extreme
ZOTAC GeForce GTX 1070 Ti AMP Extreme vs
EVGA GeForce RTX 3090 KINGPIN HYDRO COPPER GAMING
ZOTAC GeForce GTX 1070 AMP Extreme Core vs
ZOTAC GeForce GTX 1070 Ti AMP Extreme