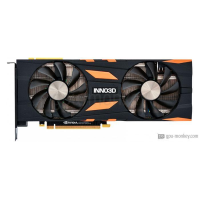
INNO3D GeForce RTX 2080 GAMING X2 OC
INNO3D GeForce RTX 2080 GAMING X2 OC launched Q3/2018, which is based on NVIDIA GeForce RTX 2080 architecture. It will come with 8 GB of high-bandwidth GDDR6 memory.The INNO3D GeForce RTX 2080 GAMING X2 OC features 2944 shader, 64 render output units, has a boost clock of 1.755 GHz+ 3 % and equipped with a power draw of 215 W. The GPU supports up to 4 monitors with resolutions of 7680x4320. In addition, if you are looking for Air cooling cooler & Axial fan-type, it would be your best choice.
| Based on | NVIDIA GeForce RTX 2080 |
| GPU Chip | TU104 |
| Execution units | 46 |
| Shader | 2944 |
| Render Output Units | 64 |
| Texture Units | 184 |
| Memory Size | 8 GB |
| Memory Type | GDDR6 |
| Memory Speed | 1.75 GHz |
| Memory Bandwith | 448 GB/s |
| Memory Interface | 256 bit |
Where to Buy?
Buy INNO3D GeForce RTX 2080 GAMING X2 OC
Clock Speeds
| Base Clock | 1.515 GHz |
| Boost Clock | 1.755 GHz + 3 % + 3 % |
| Avg (Game) Clock | 1.710 GHz |
| Overclocking |
Yes |
Thermal Design
| TDP | 215 W |
| TDP (up) | 250 W+ 5 % |
| Tjunction max | 89 °C |
| PCIe-Power | 1 x 6-Pin, 1 x 8-Pin |
Cooler & Fans
| Fan-Type | Axial |
| Fan 1 | 2 x 90 mm |
| Fan 2 | -- |
-
| Cooler-Type | Air cooling |
| Noise (Idle) | -- |
| Noise (Load): | -- |
Connectivity
| Max. Displays | 4 |
| HDCP-Version | 2.2 |
| HDMI Ports | 1x HDMI v2.0b |
| DP Ports | 3x DP v1.4a |
| DVI Ports | -- |
| VGA Ports | -- |
| USB-C Ports | 1 |
Featureset
| Max. resolution | 7680x4320 |
| DirectX | 12_2 |
| Raytracing |
Yes |
| DLSS / FSR |
Yes |
| LED | ASUS Aura Sync, GIGABYTE RGB Fusion, MSI Mystic Light |
Supported Video Codecs
| h264 | Decode / Encode |
| h265 / HEVC | Decode / Encode |
| AV1 |
No |
-
| VP8 | Decode |
| VP9 | Decode |
| Noise (Load): | -- |
Dimensions
| Length | 268 mm |
| Height | 113 mm |
| Width | -- |
| Width (Slots) | 2 PCIe-Slots |
| Weight | -- |
Additional data
| GPU Interface | PCIe 3.0 x 16 |
| Release date | Q3/2018 |
| Release price | -- |
| Structure size | 12 nm |
| Part-no | N20802-08D6X-1180633 |
FP32 Performance (Single-precision TFLOPS) - FP32 (TFLOPS)
ASUS ROG Strix GeForce RTX 2080 Advanced
10.42 (26%)
XFX Radeon RX 5700 XT Thicc III Ultra
10.37 (26%)
INNO3D GeForce RTX 2080 GAMING X2 OC
10.33 (26%)
ASUS Dual GeForce RTX 2080 Advanced
10.33 (26%)
ASUS Dual GeForce RTX 2080 Advanced Evo
10.33 (26%)
3DMark Benchmark - Time Spy (Performance) Graphics score
ZOTAC GAMING GeForce RTX 2080 Twin Fan
11205 (54%)
ASUS ROG Strix GeForce RTX 2080 Advanced
11205 (54%)
INNO3D GeForce RTX 2080 GAMING X2 OC
11160 (53%)
ASUS Dual GeForce RTX 2080 Advanced
11160 (53%)
ASUS Dual GeForce RTX 2080 Advanced Evo
11160 (53%)
3DMark Benchmark - Fire Strike (Extreme) Graphics score
Gainward GeForce GTX 1080 Ti GS
12879 (44%)
GIGABYTE GeForce GTX 1080 Ti Gaming 11G
12879 (44%)
INNO3D GeForce RTX 2080 GAMING X2 OC
12878 (44%)
ASUS Dual GeForce RTX 2080 Advanced
12878 (44%)
ASUS Dual GeForce RTX 2080 Advanced Evo
12878 (44%)
Battlefield 5 - 3840x2160 (2160p)
NVIDIA GeForce RTX 2080 Founders Edition
62 fps (avg) (52%)
ASUS ROG Strix GeForce RTX 2080 Advanced
62 fps (avg) (52%)
INNO3D GeForce RTX 2080 GAMING X2 OC
61 fps (avg) (51%)
ASUS Dual GeForce RTX 2080 Evo
61 fps (avg) (51%)
ASUS Turbo GeForce RTX 2080 Evo
61 fps (avg) (51%)
Battlefield 5 - 2560x1440 (1440p)
NVIDIA GeForce RTX 2080 Founders Edition
114 fps (avg) (57%)
MSI GeForce RTX 2080 Ventus 8G OC
114 fps (avg) (57%)
INNO3D GeForce RTX 2080 GAMING X2 OC
113 fps (avg) (56%)
ASUS ROG Strix GeForce RTX 2080 Advanced
113 fps (avg) (56%)
ASUS Dual GeForce RTX 2080 Advanced Evo
113 fps (avg) (56%)
Battlefield 5 - 1920x1080 (1080p)
ASUS ROG Strix GeForce RTX 2080 Advanced
157 fps (avg) (78%)
GIGABYTE GeForce RTX 2080 Turbo OC 8G
157 fps (avg) (78%)
INNO3D GeForce RTX 2080 GAMING X2 OC
156 fps (avg) (77%)
ASUS Dual GeForce RTX 2080 Evo
156 fps (avg) (77%)
ASUS Turbo GeForce RTX 2080 Evo
156 fps (avg) (77%)
Shadow of the Tomb Raider - 3840x2160 (2160p)
ZOTAC GAMING GeForce RTX 3060 AMP White Edition
45 fps (avg) (47%)
ASUS ROG Strix GeForce RTX 3060 OC Edition
45 fps (avg) (47%)
INNO3D GeForce RTX 2080 GAMING X2 OC
44 fps (avg) (46%)
MSI GeForce RTX 3060 GAMING X Trio 12G
44 fps (avg) (46%)
MSI GeForce RTX 3060 GAMING X 12G
44 fps (avg) (46%)
Shadow of the Tomb Raider - 2560x1440 (1440p)
GALAX GeForce RTX 2080 SG Edition
84 fps (avg) (53%)
MSI GeForce RTX 2080 Ventus 8G OC
84 fps (avg) (53%)
INNO3D GeForce RTX 2080 GAMING X2 OC
83 fps (avg) (53%)
ASUS Dual GeForce RTX 2080 Evo
83 fps (avg) (53%)
ASUS Turbo GeForce RTX 2080 Evo
83 fps (avg) (53%)
Shadow of the Tomb Raider - 1920x1080 (1080p)
PNY GeForce RTX 2080 SUPER Blower
127 fps (avg) (63%)
ASUS TUF Gaming GeForce RTX 3060 Ti
127 fps (avg) (63%)
INNO3D GeForce RTX 2080 GAMING X2 OC
126 fps (avg) (63%)
MSI GeForce RTX 3060 Ti Ventus 3X 8G
126 fps (avg) (63%)
NVIDIA GeForce RTX 3060 Ti Founders Edition
126 fps (avg) (63%)
Crypto-Mining Ethereum Hashrate (MH/s) - Ethash Hashrate
ASUS Dual GeForce RTX 2080 OC Evo
43 MH/s (36%)
ASUS Dual GeForce RTX 2080 OC
43 MH/s (36%)
INNO3D GeForce RTX 2080 GAMING X2 OC
42 MH/s (35%)
ASUS ROG Strix GeForce RTX 2080 SUPER OC White
42 MH/s (35%)
NVIDIA GeForce RTX 2080 SUPER Founders Edition
42 MH/s (35%)
Crypto-Mining Ergo Hashrate (MH/s) - Autolykos 2 Hashrate
NVIDIA GeForce RTX 2080 Founders Edition
78 MH/s (30%)
ASUS Dual GeForce RTX 2080 OC Evo
78 MH/s (30%)
INNO3D GeForce RTX 2080 GAMING X2 OC
77 MH/s (29%)
ASUS Turbo GeForce RTX 2080 Evo
77 MH/s (29%)
ASUS Dual GeForce RTX 2070 Evo V2 OC
77 MH/s (29%)
Crypto-Mining Ravencoin Hashrate (MH/s) - KawPow Hashrate
PowerColor Radeon RX 6800
28 MH/s (57%)
EVGA GeForce RTX 2080 SUPER Gaming
28 MH/s (57%)
INNO3D GeForce RTX 2080 GAMING X2 OC
27 MH/s (55%)
ASUS Turbo GeForce RTX 2080 Evo
27 MH/s (55%)
NVIDIA GeForce RTX 2080 Founders Edition
27 MH/s (55%)
Crypto-Mining Vertcoin Hashrate (MH/s) - Verthash Hashrate
GIGABYTE GeForce RTX 2080 Gaming OC 8G
0.61 MH/s (31%)
EVGA GeForce RTX 2080 XC ULTRA
0.61 MH/s (31%)
INNO3D GeForce RTX 2080 GAMING X2 OC
0.6 MH/s (31%)
ASUS Dual GeForce RTX 2080 Evo
0.6 MH/s (31%)
ASUS Turbo GeForce RTX 2080 Evo
0.6 MH/s (31%)
Popular Comparision
INNO3D GeForce RTX 2080 GAMING X2 OC vs
NVIDIA GeForce RTX 2070 Super Founders Edition
INNO3D GeForce RTX 2080 GAMING X2 OC vs
NVIDIA GeForce RTX 2070 Founders Edition
INNO3D GeForce RTX 2080 GAMING X2 OC vs
EVGA GeForce GT 1030 DDR4
MSI GeForce RTX 3060 Ti Gaming 8G LHR vs
INNO3D GeForce RTX 2080 GAMING X2 OC
MSI GeForce RTX 2060 SUPER VENTUS vs
INNO3D GeForce RTX 2080 GAMING X2 OC
KFA2 GeForce RTX 2080 SUPER EX (1-Click OC) PINK Edition vs
INNO3D GeForce RTX 2080 GAMING X2 OC
KFA2 GeForce GTX 1060 OC 3GB vs
INNO3D GeForce RTX 2080 GAMING X2 OC
INNO3D GeForce RTX 2080 GAMING X2 OC vs
XFX Speedster MERC 319 Radeon RX 6700 XT Black Gaming