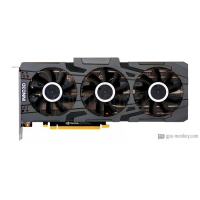
INNO3D GeForce RTX 2080 SUPER GAMING OC X3
INNO3D GeForce RTX 2080 SUPER GAMING OC X3 launched Q3/2019, which is based on NVIDIA GeForce RTX 2080 SUPER architecture. It will come with 8 GB of high-bandwidth GDDR6 memory.The INNO3D GeForce RTX 2080 SUPER GAMING OC X3 features 3072 shader, 64 render output units, has a boost clock of 1.845 GHz+ 2 % and equipped with a power draw of 250 W. The GPU supports up to 4 monitors with resolutions of 7680x4320. In addition, if you are looking for Air cooling cooler & Axial fan-type, it would be your best choice.
| Based on | NVIDIA GeForce RTX 2080 SUPER |
| GPU Chip | TU104 |
| Execution units | 48 |
| Shader | 3072 |
| Render Output Units | 64 |
| Texture Units | 192 |
| Memory Size | 8 GB |
| Memory Type | GDDR6 |
| Memory Speed | 1.938 GHz |
| Memory Bandwith | 496 GB/s |
| Memory Interface | 256 bit |
Where to Buy?
Buy INNO3D GeForce RTX 2080 SUPER GAMING OC X3
Clock Speeds
| Base Clock | 1.650 GHz |
| Boost Clock | 1.845 GHz + 2 % + 2 % |
| Avg (Game) Clock | 1.815 GHz |
| Overclocking |
Yes |
Thermal Design
| TDP | 250 W |
| TDP (up) | 280 W |
| Tjunction max | -- |
| PCIe-Power | 1 x 6-Pin, 1 x 8-Pin |
Cooler & Fans
| Fan-Type | Axial |
| Fan 1 | 3 x 90 mm |
| Fan 2 | -- |
-
| Cooler-Type | Air cooling |
| Noise (Idle) | 0 dB / Silent |
| Noise (Load): | 43 dB |
Connectivity
| Max. Displays | 4 |
| HDCP-Version | 2.2 |
| HDMI Ports | 1x HDMI v2.0b |
| DP Ports | 3x DP v1.4a |
| DVI Ports | -- |
| VGA Ports | -- |
| USB-C Ports | -- |
Featureset
| Max. resolution | 7680x4320 |
| DirectX | 12_2 |
| Raytracing |
Yes |
| DLSS / FSR |
Yes |
| LED | No LED lighting |
Supported Video Codecs
| h264 | Decode / Encode |
| h265 / HEVC | Decode / Encode |
| AV1 |
No |
-
| VP8 | Decode |
| VP9 | Decode |
| Noise (Load): | 43 dB |
Dimensions
| Length | 272 mm |
| Height | 118 mm |
| Width | -- |
| Width (Slots) | 2 PCIe-Slots |
| Weight | -- |
Additional data
| GPU Interface | PCIe 3.0 x 16 |
| Release date | Q3/2019 |
| Release price | -- |
| Structure size | 12 nm |
| Part-no | N208S3-08D6X-1180VA24 |
FP32 Performance (Single-precision TFLOPS) - FP32 (TFLOPS)
Gainward GeForce GTX 1080 Ti Founders Edition
11.35 (28%)
INNO3D GeForce RTX 2080 SUPER GAMING OC X3
11.34 (28%)
ASUS Turbo GeForce RTX 2080 SUPER Evo
11.34 (28%)
ASUS Dual GeForce RTX 2080 SUPER Evo V2
11.34 (28%)
3DMark Benchmark - Time Spy (Performance) Graphics score
GIGABYTE AORUS GeForce RTX 2080 Xtreme 8G
11610 (56%)
INNO3D GeForce RTX 2080 SUPER GAMING OC X3
11588 (55%)
ASUS Turbo GeForce RTX 2080 SUPER Evo
11588 (55%)
ASUS Dual GeForce RTX 2080 SUPER Evo V2
11588 (55%)
3DMark Benchmark - Fire Strike (Extreme) Graphics score
Palit GeForce RTX 2080 SUPER GRP
13347 (45%)
INNO3D GeForce RTX 2080 SUPER GAMING OC X3
13294 (45%)
ASUS Turbo GeForce RTX 2080 SUPER Evo
13294 (45%)
ASUS Dual GeForce RTX 2080 SUPER Evo V2
13294 (45%)
Battlefield 5 - 3840x2160 (2160p)
GIGABYTE AORUS GeForce GTX 1080 Ti Xtreme Edition 11G
68 fps (avg) (57%)
ASUS ROG Strix GeForce RTX 2080 SUPER OC
68 fps (avg) (57%)
INNO3D GeForce RTX 2080 SUPER GAMING OC X3
67 fps (avg) (56%)
MSI GeForce RTX 3060 Ti Ventus 2X 8G OCV1
67 fps (avg) (56%)
MSI GeForce RTX 3060 Ti Ventus 3X 8G OC
67 fps (avg) (56%)
Battlefield 5 - 2560x1440 (1440p)
ASUS ROG Strix GeForce RTX 2080 SUPER OC White
120 fps (avg) (60%)
Palit GeForce RTX 3060 Ti Dual V1 LHR
120 fps (avg) (60%)
INNO3D GeForce RTX 2080 SUPER GAMING OC X3
119 fps (avg) (59%)
ASUS Dual GeForce RTX 2080 SUPER OC Evo V2
119 fps (avg) (59%)
ASUS Dual GeForce RTX 2080 SUPER Evo V2
119 fps (avg) (59%)
Battlefield 5 - 1920x1080 (1080p)
MSI GeForce RTX 3060 Ti Ventus 3X 8G OC
164 fps (avg) (81%)
Colorful GeForce RTX 3060 Ti NB LHR-V
164 fps (avg) (81%)
INNO3D GeForce RTX 2080 SUPER GAMING OC X3
163 fps (avg) (81%)
ASUS Dual GeForce RTX 2080 SUPER OC Evo V2
163 fps (avg) (81%)
ASUS Dual GeForce RTX 2080 SUPER Evo V2
163 fps (avg) (81%)
Shadow of the Tomb Raider - 3840x2160 (2160p)
GIGABYTE GeForce RTX 3060 Ti Gaming OC 8G
48 fps (avg) (50%)
ASUS Dual GeForce RTX 3060 Ti Mini OC V2 LHR
48 fps (avg) (50%)
INNO3D GeForce RTX 2080 SUPER GAMING OC X3
47 fps (avg) (49%)
MSI GeForce RTX 3060 Ti Ventus 3X 8G OC
47 fps (avg) (49%)
NVIDIA GeForce RTX 3060 Ti Founders Edition
47 fps (avg) (49%)
Shadow of the Tomb Raider - 2560x1440 (1440p)
ASUS Radeon RX 6700 XT
92 fps (avg) (58%)
GIGABYTE Radeon RX 6700 XT EAGLE 12G
92 fps (avg) (58%)
INNO3D GeForce RTX 2080 SUPER GAMING OC X3
91 fps (avg) (58%)
MSI GeForce RTX 3070 Ventus 2X 8G OC
91 fps (avg) (58%)
NVIDIA GeForce RTX 3060 Ti Founders Edition
91 fps (avg) (58%)
Shadow of the Tomb Raider - 1920x1080 (1080p)
ASUS ROG STRIX Radeon RX 6700 XT OC Edition
129 fps (avg) (64%)
ASRock Radeon RX 6700 XT Phantom Gaming D 12GB OC
129 fps (avg) (64%)
INNO3D GeForce RTX 2080 SUPER GAMING OC X3
128 fps (avg) (64%)
ASUS Dual GeForce RTX 3060 Ti OC
128 fps (avg) (64%)
MSI GeForce RTX 3060 Ti Gaming Trio 8G
128 fps (avg) (64%)
Crypto-Mining Ethereum Hashrate (MH/s) - Ethash Hashrate
ASUS Dual GeForce RTX 2080 OC
43 MH/s (36%)
ASUS Dual GeForce RTX 2080 OC Evo
43 MH/s (36%)
INNO3D GeForce RTX 2080 SUPER GAMING OC X3
42 MH/s (35%)
ASUS ROG Strix GeForce RTX 2080 SUPER OC White
42 MH/s (35%)
NVIDIA GeForce RTX 2080 SUPER Founders Edition
42 MH/s (35%)
Crypto-Mining Ergo Hashrate (MH/s) - Autolykos 2 Hashrate
ASUS Dual GeForce RTX 2080 SUPER OC Evo V2
83 MH/s (31%)
ASUS ROG Strix GeForce RTX 2080 SUPER OC White
83 MH/s (31%)
INNO3D GeForce RTX 2080 SUPER GAMING OC X3
82 MH/s (31%)
ASUS Dual GeForce RTX 2080 SUPER Evo V2
82 MH/s (31%)
NVIDIA GeForce RTX 2080 SUPER Founders Edition
82 MH/s (31%)
Crypto-Mining Ravencoin Hashrate (MH/s) - KawPow Hashrate
ASUS ROG Strix GeForce RTX 3070 White
29 MH/s (59%)
ASUS Dual GeForce RTX 3070 V2 LHR
29 MH/s (59%)
INNO3D GeForce RTX 2080 SUPER GAMING OC X3
28 MH/s (57%)
AMD Radeon RX 6800
28 MH/s (57%)
GIGABYTE Radeon RX 6800 Gaming OC 16G
28 MH/s (57%)
Crypto-Mining Vertcoin Hashrate (MH/s) - Verthash Hashrate
EVGA GeForce RTX 2080 XC ULTRA
0.61 MH/s (31%)
GIGABYTE GeForce RTX 2080 Gaming OC 8G
0.61 MH/s (31%)
KFA2 GeForce RTX 2080
0.6 MH/s (31%)
ASUS Dual GeForce RTX 2080 Evo
0.6 MH/s (31%)
ASUS Turbo GeForce RTX 2080 Evo
0.6 MH/s (31%)