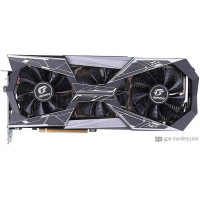
Colorful iGame GeForce RTX 2060 SUPER Vulcan OC-V
Colorful iGame GeForce RTX 2060 SUPER Vulcan OC-V은 NVIDIA GeForce RTX 2060 SUPER 아키텍처를 기반으로 하는 Q3/2019를 출시했습니다. 고대역폭 GDDR6 메모리의 MEMORYSIZ와 함께 제공됩니다.Colorful iGame GeForce RTX 2060 SUPER Vulcan OC-V 기능 2176 쉐이더는, 64 출력 단위를 렌더링의 부스트 클럭이 1.815 GHz+ 10 % 그리고 그릴 전력을 갖추고 175 W . GPU는 해상도가 7680x4320 4 모니터를 지원합니다. 또한 Air cooling 쿨러 & Axial 팬타입을 찾으신다면 최고의 선택이 될 것입니다.
| Based on | NVIDIA GeForce RTX 2060 SUPER |
| GPU Chip | TU106 |
| 실행 단위 | 34 |
| 셰이더 | 2176 |
| Render Output Units | 64 |
| Texture Units | 136 |
| Memory Size | 8 GB |
| Memory Type | GDDR6 |
| Memory Speed | 1.75 GHz |
| Memory Bandwith | 448 GB/s |
| Memory Interface | 256 bit |
Clock Speeds
| Base Clock | 1.470 GHz |
| Boost Clock | 1.815 GHz + 10 % + 10 % |
| Avg (Game) Clock | 1.650 GHz |
| 오버클럭 |
Yes |
Thermal Design
| TDP | 175 W |
| TDP (up) | -- |
| Tjunction max | -- |
| PCIe-Power | 2 x 8-Pin |
Cooler & Fans
| Fan-Type | Axial |
| Fan 1 | 2 x 90 mm |
| Fan 2 | 1 x 80 mm |
-
| Cooler-Type | Air cooling |
| Noise (Idle) | 0 dB / Silent |
| Noise (Load): | -- |
Connectivity
| Max. Displays | 4 |
| HDCP-Version | 2.2 |
| HDMI Ports | 1x HDMI v2.0b |
| DP Ports | 3x DP v1.4a |
| DVI Ports | -- |
| VGA Ports | -- |
| USB-C Ports | 1 |
Featureset
| Max. resolution | 7680x4320 |
| DirectX | 12_2 |
| Raytracing |
Yes |
| DLSS / FSR |
Yes |
| LED | iGame Energy Core |
Supported Video Codecs
| h264 | Decode / Encode |
| h265 / HEVC | Decode / Encode |
| AV1 |
No |
-
| VP8 | Decode |
| VP9 | Decode |
| Noise (Load): | -- |
Dimensions
| Length | 318 mm |
| Height | 147 mm |
| Width | 59 mm |
| Width (Slots) | 3 PCIe-Slots |
| Weight | 1400 g |
Additional data
| GPU Interface | PCIe 3.0 x 16 |
| 출시일 | Q3/2019 |
| Release price | -- |
| Structure size | 12 nm |
| Part-no | -- |
FP32 Performance (Single-precision TFLOPS) - FP32 (TFLOPS)
3DMark Benchmark - Time Spy (Performance) Graphics score
3DMark Benchmark - Fire Strike (Extreme) Graphics score
Gainward GeForce RTX 2060 SUPER Phantom GS
10798 (37%)
NVIDIA GeForce RTX 3080 Laptop (Mobile) - 115 W
10780 (37%)
Battlefield 5 - 3840x2160 (2160p)
ASUS ROG Strix GeForce RTX 2060 SUPER EVO OC Edition
50 fps (avg) (42%)
GIGABYTE AORUS GeForce RTX 2060 SUPER 8G (rev. 1.0)
49 fps (avg) (41%)
Colorful iGame GeForce RTX 2060 SUPER Vulcan OC-V
48 fps (avg) (40%)
GIGABYTE GeForce RTX 2060 SUPER GAMING OC 3X WHITE 8G (rev. 1.0)
48 fps (avg) (40%)
GIGABYTE AORUS GeForce RTX 2060 SUPER 8G (rev. 2.0)
48 fps (avg) (40%)
Battlefield 5 - 2560x1440 (1440p)
ASUS Dual GeForce RTX 2070 Evo OC
96 fps (avg) (48%)
ASUS Dual GeForce RTX 2070 Evo V2 OC
96 fps (avg) (48%)
Colorful iGame GeForce RTX 2060 SUPER Vulcan OC-V
95 fps (avg) (47%)
ASUS ROG Strix GeForce RTX 2070 Advanced
95 fps (avg) (47%)
ASUS Dual GeForce RTX 2070 Mini OC
95 fps (avg) (47%)
Battlefield 5 - 1920x1080 (1080p)
ASUS ROG Strix GeForce RTX 2060 SUPER OC Edition
123 fps (avg) (61%)
ASUS ROG Strix GeForce RTX 2060 SUPER EVO OC Edition
123 fps (avg) (61%)
Colorful iGame GeForce RTX 2060 SUPER Vulcan OC-V
122 fps (avg) (60%)
GIGABYTE GeForce RTX 2060 SUPER GAMING OC 3X WHITE 8G (rev. 1.0)
122 fps (avg) (60%)
GIGABYTE AORUS GeForce RTX 2060 SUPER 8G (rev. 2.0)
122 fps (avg) (60%)
Shadow of the Tomb Raider - 3840x2160 (2160p)
MSI GeForce RTX 2070 GAMING Z 8G
38 fps (avg) (40%)
ASUS ROG Strix GeForce RTX 2070 OC
38 fps (avg) (40%)
Colorful iGame GeForce RTX 2060 SUPER Vulcan OC-V
37 fps (avg) (39%)
ASUS Dual GeForce RTX 2070 Evo OC
37 fps (avg) (39%)
ASUS Dual GeForce RTX 2070 Evo V2 OC
37 fps (avg) (39%)
Shadow of the Tomb Raider - 2560x1440 (1440p)
ASUS ROG Strix GeForce RTX 2060 SUPER OC Edition
65 fps (avg) (41%)
ASUS ROG Strix GeForce RTX 2060 SUPER EVO OC Edition
65 fps (avg) (41%)
Colorful iGame GeForce RTX 2060 SUPER Vulcan OC-V
64 fps (avg) (41%)
ASUS Dual GeForce RTX 2060 SUPER EVO OC Edition
64 fps (avg) (41%)
ASUS Dual GeForce RTX 2060 SUPER EVO V2 OC Edition
64 fps (avg) (41%)
Shadow of the Tomb Raider - 1920x1080 (1080p)
ASUS ROG Strix GeForce RTX 2060 SUPER OC Edition
91 fps (avg) (45%)
ASUS ROG Strix GeForce RTX 2060 SUPER EVO OC Edition
91 fps (avg) (45%)
Colorful iGame GeForce RTX 2060 SUPER Vulcan OC-V
90 fps (avg) (45%)
GIGABYTE GeForce RTX 2060 SUPER GAMING OC 3X WHITE 8G (rev. 1.0)
90 fps (avg) (45%)
GIGABYTE AORUS GeForce RTX 2060 SUPER 8G (rev. 2.0)
90 fps (avg) (45%)
Crypto-Mining Ethereum Hashrate (MH/s) - Ethash Hashrate
GIGABYTE AORUS GeForce RTX 2070 8G
41 MH/s (34%)
ASUS ROG Strix GeForce RTX 2070 OC
41 MH/s (34%)
Colorful iGame GeForce RTX 2060 SUPER Vulcan OC-V
40 MH/s (33%)
ASUS Dual GeForce RTX 2070 Evo V2
40 MH/s (33%)
ASUS Dual GeForce RTX 2070 Evo V2 OC
40 MH/s (33%)
Crypto-Mining Ergo Hashrate (MH/s) - Autolykos 2 Hashrate
ASUS Dual GeForce RTX 2080 SUPER OC Evo V2
83 MH/s (31%)
ASUS ROG Strix GeForce RTX 2080 SUPER OC White
83 MH/s (31%)
Colorful iGame GeForce RTX 2060 SUPER Vulcan OC-V
82 MH/s (31%)
ASUS Dual GeForce RTX 2080 SUPER Evo V2
82 MH/s (31%)
NVIDIA GeForce RTX 2080 SUPER Founders Edition
82 MH/s (31%)
Crypto-Mining Ravencoin Hashrate (MH/s) - KawPow Hashrate
ASUS ROG Strix GeForce RTX 2060 OC Edition
20 MH/s (41%)
ASUS ROG Strix GeForce RTX 2060 EVO OC Edition
20 MH/s (41%)
Colorful iGame GeForce RTX 2060 SUPER Vulcan OC-V
19 MH/s (39%)
ASUS ROG Strix GeForce RTX 2060 SUPER EVO OC Edition
19 MH/s (39%)
Crypto-Mining Vertcoin Hashrate (MH/s) - Verthash Hashrate
ASUS ROG Strix GeForce RTX 2060 EVO Advanced Edition
0.46 MH/s (24%)
ASUS Dual GeForce RTX 2060 MINI OC Edition
0.46 MH/s (24%)
INNO3D GeForce RTX 2060 TWIN X2
0.45 MH/s (23%)
MSI GeForce RTX 3060 Ti Ventus 2X 8G V1 LHR
0.45 MH/s (23%)
ASUS Dual GeForce RTX 3060 Ti Mini V2 LHR
0.45 MH/s (23%)
인기있는 비교
MSI GeForce RTX 2060 GAMING 6G PLUS vs
Colorful iGame GeForce RTX 2060 SUPER Vulcan OC-V
ASUS ROG Strix LC Radeon RX 6900 XT TOP vs
Colorful iGame GeForce RTX 2060 SUPER Vulcan OC-V
ASUS GeForce RTX 3070 Noctua Edition vs
Colorful iGame GeForce RTX 2060 SUPER Vulcan OC-V
ASUS Dual GeForce RTX 3060 vs
Colorful iGame GeForce RTX 2060 SUPER Vulcan OC-V