INNO3D GeForce GTX 1080 iCHILL X3
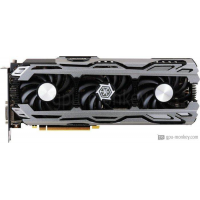
INNO3D GeForce GTX 1080 iCHILL X3은 NVIDIA GeForce GTX 1080 아키텍처를 기반으로 하는 Q2/2016를 출시했습니다. 고대역폭 GDDR5X 메모리의 MEMORYSIZ와 함께 제공됩니다.INNO3D GeForce GTX 1080 iCHILL X3 기능 2560 쉐이더는, 64 출력 단위를 렌더링의 부스트 클럭이 1.898 GHz+ 10 % 그리고 그릴 전력을 갖추고 230 W + 28 % . GPU는 해상도가 7680x4320 4 모니터를 지원합니다. 또한 Air cooling 쿨러 & Axial 팬타입을 찾으신다면 최고의 선택이 될 것입니다.
| Based on | NVIDIA GeForce GTX 1080 |
| GPU Chip | GP104-400-A1 / GP104-410-A1 |
| 실행 단위 | 20 |
| 셰이더 | 2560 |
| Render Output Units | 64 |
| Texture Units | 160 |
| Memory Size | 8 GB |
| Memory Type | GDDR5X |
| Memory Speed | 1.3 GHz |
| Memory Bandwith | 332 GB/s |
| Memory Interface | 256 bit |
Clock Speeds
| Base Clock | 1.759 GHz+ 9 % |
| Boost Clock | 1.898 GHz+ 10 % |
| Avg (Game) Clock | |
| 오버클럭 |
Yes |
Thermal Design
| TDP | 230 W+ 28 % |
| TDP (up) | -- |
| Tjunction max | -- |
| PCIe-Power | 1 x 6-Pin, 1 x 8-Pin |
Cooler & Fans
| Fan-Type | Axial |
| Fan 1 | 3 x 90 mm |
| Fan 2 | -- |
-
| Cooler-Type | Air cooling |
| Noise (Idle) | 0 dB / Silent |
| Noise (Load): | -- |
Connectivity
| Max. Displays | 4 |
| HDCP-Version | 2.2 |
| HDMI Ports | 1x HDMI v2.0b |
| DP Ports | 3x DP v1.4 |
| DVI Ports | 1 |
| VGA Ports | -- |
| USB-C Ports | -- |
Featureset
| Max. resolution | 7680x4320 |
| DirectX | 12_1 |
| Raytracing |
No |
| DLSS / FSR |
No |
| LED | ASUS Aura Sync, GIGABYTE RGB Fusion, MSI Mystic Light |
Supported Video Codecs
| h264 | Decode / Encode |
| h265 / HEVC | Decode / Encode |
| AV1 |
No |
-
| VP8 | Decode |
| VP9 | Decode |
| Noise (Load): | -- |
Dimensions
| Length | 302 mm |
| Height | 109 mm |
| Width | -- |
| Width (Slots) | 3 PCIe-Slots |
| Weight | -- |
Additional data
| GPU Interface | PCIe 3.0 x 16 |
| 출시일 | Q2/2016 |
| Release price | -- |
| Structure size | 16 nm |
| Part-no | C108V3-2SDN-P6DNX |
FP32 Performance (Single-precision TFLOPS) - FP32 (TFLOPS)
INNO3D GeForce RTX 2070 SUPER ICHILL BLACK
9.75 (24%)
GIGABYTE AORUS GeForce RTX 2070 SUPER 8G
9.75 (24%)
INNO3D GeForce GTX 1080 iCHILL X3
9.72 (24%)
INNO3D GeForce GTX 1080 iCHILL X4 11Gbps
9.72 (24%)
Colorful iGame GeForce GTX 1080 X-TOP-8G
9.72 (24%)
3DMark Benchmark - Time Spy (Performance) Graphics score
ZOTAC GeForce GTX 1080 AMP Extreme
7816 (37%)
MSI GeForce GTX 1080 GAMING Z 8G
7816 (37%)
INNO3D GeForce GTX 1080 iCHILL X3
7793 (37%)
INNO3D GeForce GTX 1080 iCHILL Black
7793 (37%)
INNO3D GeForce GTX 1080 iCHILL X4
7793 (37%)
3DMark Benchmark - Fire Strike (Extreme) Graphics score
ZOTAC GeForce GTX 1080 AMP Extreme
9797 (33%)
MSI GeForce GTX 1080 GAMING Z 8G
9797 (33%)
INNO3D GeForce GTX 1080 iCHILL X3
9768 (33%)
INNO3D GeForce GTX 1080 iCHILL X3 11Gbps
9768 (33%)
INNO3D GeForce GTX 1080 iCHILL Black
9768 (33%)
Battlefield 5 - 3840x2160 (2160p)
MSI GeForce RTX 3060 GAMING X Trio 12G
55 fps (avg) (46%)
MSI GeForce RTX 3060 GAMING X 12G
55 fps (avg) (46%)
INNO3D GeForce GTX 1080 iCHILL X3
54 fps (avg) (45%)
ZOTAC GAMING GeForce RTX 3060 Twin Edge
54 fps (avg) (45%)
ZOTAC GAMING GeForce RTX 3060 Twin Edge OC
54 fps (avg) (45%)
Battlefield 5 - 2560x1440 (1440p)
MSI GeForce RTX 3060 AERO ITX 12G
100 fps (avg) (50%)
ZOTAC GAMING GeForce RTX 3060 Twin Edge
100 fps (avg) (50%)
INNO3D GeForce GTX 1080 iCHILL X3
99 fps (avg) (49%)
MSI GeForce RTX 2070 SUPER GAMING X TRIO
99 fps (avg) (49%)
ASUS ROG Strix GeForce RTX 2070 OC
99 fps (avg) (49%)
Battlefield 5 - 1920x1080 (1080p)
EVGA GeForce RTX 2070 SUPER FTW3 ULTRA
131 fps (avg) (65%)
MSI GeForce RTX 2070 SUPER GAMING Z TRIO
131 fps (avg) (65%)
INNO3D GeForce GTX 1080 iCHILL X3
130 fps (avg) (64%)
MSI GeForce RTX 2070 SUPER ARMOR
130 fps (avg) (64%)
ZOTAC GAMING GeForce RTX 2070 AMP Extreme
130 fps (avg) (64%)
Shadow of the Tomb Raider - 3840x2160 (2160p)
GIGABYTE AORUS GeForce GTX 1080 Xtreme Edition 8G 11Gbps
34 fps (avg) (35%)
ASUS ROG Strix GeForce GTX 1080 OC edition
34 fps (avg) (35%)
INNO3D GeForce GTX 1080 iCHILL X3
33 fps (avg) (34%)
EVGA GeForce GTX 1080 FTW HYBRID GAMING
33 fps (avg) (34%)
Colorful iGame GeForce GTX 1080 X-TOP-8G
33 fps (avg) (34%)
Shadow of the Tomb Raider - 2560x1440 (1440p)
ASUS Dual GeForce RTX 2060 SUPER EVO OC Edition
64 fps (avg) (41%)
ASUS Dual GeForce RTX 2060 SUPER EVO V2 OC Edition
64 fps (avg) (41%)
INNO3D GeForce GTX 1080 iCHILL X3
63 fps (avg) (40%)
ASUS ROG Strix GeForce RTX 2060 SUPER EVO Advanced Edition
63 fps (avg) (40%)
ASUS ROG Strix GeForce RTX 2060 SUPER EVO
63 fps (avg) (40%)
Shadow of the Tomb Raider - 1920x1080 (1080p)
ASUS ROG Strix GeForce GTX 1080 OC edition
100 fps (avg) (50%)
ZOTAC GAMING GeForce RTX 2070 AMP Extreme
100 fps (avg) (50%)
INNO3D GeForce GTX 1080 iCHILL X3
99 fps (avg) (49%)
Colorful iGame GeForce GTX 1080 X-TOP-8G
99 fps (avg) (49%)
ASUS ROG Strix GeForce RTX 2070 OC
99 fps (avg) (49%)
Crypto-Mining Ethereum Hashrate (MH/s) - Ethash Hashrate
ASUS Dual GeForce RTX 2070 Evo V2
40 MH/s (33%)
ASUS Dual GeForce RTX 2070 Evo V2 OC
40 MH/s (33%)
INNO3D GeForce GTX 1080 iCHILL X3
39 MH/s (32%)
ASUS ROG Strix GeForce RTX 2060 SUPER EVO
39 MH/s (32%)
Crypto-Mining Ergo Hashrate (MH/s) - Autolykos 2 Hashrate
ASUS Dual GeForce RTX 2080 SUPER OC Evo V2
83 MH/s (31%)
ASUS ROG Strix GeForce RTX 2080 SUPER OC White
83 MH/s (31%)
INNO3D GeForce GTX 1080 iCHILL X3
82 MH/s (31%)
ASUS Dual GeForce RTX 2080 SUPER Evo V2
82 MH/s (31%)
NVIDIA GeForce RTX 2080 SUPER Founders Edition
82 MH/s (31%)
Crypto-Mining Ravencoin Hashrate (MH/s) - KawPow Hashrate
ASUS ROG Strix Radeon RX 5700 XT OC
18 MH/s (37%)
INNO3D GeForce GTX 1080 iCHILL X3
17 MH/s (35%)
MSI Radeon RX 5700 XT Mech OC
17 MH/s (35%)
MSI Radeon RX 5700 XT Gaming X
17 MH/s (35%)
Crypto-Mining Vertcoin Hashrate (MH/s) - Verthash Hashrate
GIGABYTE AORUS GeForce GTX 1080 Xtreme Edition 8G 11Gbps
0.51 MH/s (26%)
ASUS ROG Strix GeForce GTX 1080 OC edition
0.51 MH/s (26%)
INNO3D GeForce GTX 1080 iCHILL X3
0.5 MH/s (26%)
ASUS KO GeForce RTX 3070 V2 OC LHR
0.5 MH/s (26%)
Palit GeForce RTX 3070 GameRock OC V1 LHR
0.5 MH/s (26%)