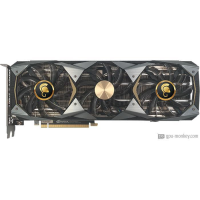
MANLI GeForce RTX 2080Ti Gallardo (F398G+N504-00)
MANLI GeForce RTX 2080Ti Gallardo (F398G+N504-00) launched Q3/2018, which is based on NVIDIA GeForce RTX 2080 Ti architecture. It will come with 11 GB of high-bandwidth GDDR6 memory.The MANLI GeForce RTX 2080Ti Gallardo (F398G+N504-00) features 4352 shader, 88 render output units, has a boost clock of 1.635 GHz+ 6 % and equipped with a power draw of 260 W + 4 %. The GPU supports up to 4 monitors with resolutions of 7680x4320. In addition, if you are looking for Air cooling cooler & Axial fan-type, it would be your best choice.
| Based on | NVIDIA GeForce RTX 2080 Ti |
| GPU Chip | TU102 |
| Execution units | 68 |
| Shader | 4352 |
| Render Output Units | 88 |
| Texture Units | 272 |
| Memory Size | 11 GB |
| Memory Type | GDDR6 |
| Memory Speed | 1.75 GHz |
| Memory Bandwith | 616 GB/s |
| Memory Interface | 352 bit |
Where to Buy?
Buy MANLI GeForce RTX 2080Ti Gallardo (F398G+N504-00)
Clock Speeds
| Base Clock | 1.350 GHz |
| Boost Clock | 1.635 GHz+ 6 % |
| Avg (Game) Clock | 1.545 GHz |
| Overclocking |
Yes |
Thermal Design
| TDP | 260 W+ 4 % |
| TDP (up) | -- |
| Tjunction max | -- |
| PCIe-Power | 2 x 8-Pin |
Cooler & Fans
| Fan-Type | Axial |
| Fan 1 | 3 x 90 mm |
| Fan 2 | -- |
-
| Cooler-Type | Air cooling |
| Noise (Idle) | 0 dB / Silent |
| Noise (Load): | -- |
Connectivity
| Max. Displays | 4 |
| HDCP-Version | 2.2 |
| HDMI Ports | 1x HDMI v2.0b |
| DP Ports | 3x DP v1.4a |
| DVI Ports | -- |
| VGA Ports | -- |
| USB-C Ports | 1 |
Featureset
| Max. resolution | 7680x4320 |
| DirectX | 12_2 |
| Raytracing |
Yes |
| DLSS / FSR |
Yes |
| LED | No LED lighting |
Supported Video Codecs
| h264 | Decode / Encode |
| h265 / HEVC | Decode / Encode |
| AV1 |
No |
-
| VP8 | Decode |
| VP9 | Decode |
| Noise (Load): | -- |
Dimensions
| Length | 314 mm |
| Height | 128 mm |
| Width | 44 mm |
| Width (Slots) | 2 PCIe-Slots |
| Weight | -- |
Additional data
| GPU Interface | PCIe 3.0 x 16 |
| Release date | Q3/2018 |
| Release price | -- |
| Structure size | 12 nm |
| Part-no | M-NRTX2080TIG/6RIHPPPC-F398G |
FP32 Performance (Single-precision TFLOPS) - FP32 (TFLOPS)
Gainward GeForce RTX 2080 Ti Phoenix
14.36 (36%)
EVGA GeForce RTX 2080 Ti XC2 Ultra Gaming
14.36 (36%)
MSI GeForce RTX 2080 Ti Ventus GP OC
14.23 (35%)
NVIDIA GeForce RTX 2080 Ti Founders Edition
14.23 (35%)
3DMark Benchmark - Time Spy (Performance) Graphics score
Colorful iGame GeForce RTX 3070 Vulcan OC-V
14472 (69%)
Colorful iGame GeForce RTX 3070 Vulcan OC LHR-V
14472 (69%)
MSI GeForce RTX 2080 Ti Ventus GP OC
14358 (69%)
NVIDIA GeForce RTX 2080 Ti Founders Edition
14358 (69%)
3DMark Benchmark - Fire Strike (Extreme) Graphics score
EVGA GeForce RTX 2080 Ti XC Ultra Gaming
16602 (56%)
Gainward GeForce RTX 2080 Ti Phoenix
16602 (56%)
MSI GeForce RTX 2080 Ti Ventus GP OC
16520 (56%)
NVIDIA GeForce RTX 2080 Ti Founders Edition
16520 (56%)
Battlefield 5 - 3840x2160 (2160p)
INNO3D GeForce RTX 2080 Ti GAMING OC X3
81 fps (avg) (68%)
MSI GeForce RTX 2080 Ti Duke 11G OC
81 fps (avg) (68%)
MANLI GeForce RTX 2080Ti Gallardo (F398G+N504-00)
80 fps (avg) (67%)
GIGABYTE GeForce RTX 3070 Eagle OC 8G
80 fps (avg) (67%)
MSI GeForce RTX 3070 Gaming Trio 8G
80 fps (avg) (67%)
Battlefield 5 - 2560x1440 (1440p)
MSI GeForce RTX 3070 Twin Fan 8G OC
138 fps (avg) (69%)
INNO3D GeForce RTX 2080 Ti GAMING OC X3
138 fps (avg) (69%)
MANLI GeForce RTX 2080Ti Gallardo (F398G+N504-00)
137 fps (avg) (68%)
MSI GeForce RTX 3070 Twin Fan 8G
137 fps (avg) (68%)
NVIDIA GeForce RTX 3070 Founders Edition
137 fps (avg) (68%)
Battlefield 5 - 1920x1080 (1080p)
ASUS ROG Strix GeForce RTX 2080 Ti OC
190 fps (avg) (94%)
MSI GeForce RTX 3070 Suprim X 8G LHR
190 fps (avg) (94%)
MANLI GeForce RTX 2080Ti Gallardo (F398G+N504-00)
189 fps (avg) (94%)
MSI GeForce RTX 3080 GAMING X TRIO 10G
189 fps (avg) (94%)
ASUS TUF Gaming GeForce RTX 3080 OC
189 fps (avg) (94%)
Shadow of the Tomb Raider - 3840x2160 (2160p)
Gainward GeForce RTX 2080 Ti Phoenix
58 fps (avg) (60%)
GIGABYTE AORUS GeForce RTX 2080 Ti Turbo 11G
58 fps (avg) (60%)
MANLI GeForce RTX 2080Ti Gallardo (F398G+N504-00)
57 fps (avg) (59%)
MSI GeForce RTX 2080 Ti Ventus GP OC
57 fps (avg) (59%)
NVIDIA GeForce RTX 2080 Ti Founders Edition
57 fps (avg) (59%)
Shadow of the Tomb Raider - 2560x1440 (1440p)
Palit GeForce RTX 2080 Ti GamingPro OC
109 fps (avg) (69%)
ASUS Dual GeForce RTX 2080 Ti OC
109 fps (avg) (69%)
MANLI GeForce RTX 2080Ti Gallardo (F398G+N504-00)
108 fps (avg) (68%)
MSI GeForce RTX 2080 Ti Ventus GP OC
108 fps (avg) (68%)
NVIDIA GeForce RTX 2080 Ti Founders Edition
108 fps (avg) (68%)
Shadow of the Tomb Raider - 1920x1080 (1080p)
MSI GeForce RTX 2080 Ti Duke 11G OC
146 fps (avg) (73%)
ASUS ROG Strix GeForce RTX 2080 Ti OC
146 fps (avg) (73%)
MANLI GeForce RTX 2080Ti Gallardo (F398G+N504-00)
145 fps (avg) (72%)
MSI GeForce RTX 3070 Suprim 8G
145 fps (avg) (72%)
MSI GeForce RTX 3070 Gaming X Trio 8G
145 fps (avg) (72%)
Crypto-Mining Ethereum Hashrate (MH/s) - Ethash Hashrate
MSI GeForce RTX 2080 Ti Duke 11G OC
60 MH/s (50%)
Colorful iGame GeForce RTX 2080 Ti Kudan-V
60 MH/s (50%)
MANLI GeForce RTX 2080Ti Gallardo (F398G+N504-00)
59 MH/s (49%)
ASUS ROG Strix GeForce RTX 2080 Ti
59 MH/s (49%)
NVIDIA GeForce RTX 2080 Ti Founders Edition
59 MH/s (49%)
Crypto-Mining Ergo Hashrate (MH/s) - Autolykos 2 Hashrate
MSI GeForce RTX 2080 Ti Gaming X Trio
118 MH/s (45%)
GALAX GeForce RTX 2080 Ti HOF 10th Anniversary Edition
118 MH/s (45%)
MANLI GeForce RTX 2080Ti Gallardo (F398G+N504-00)
117 MH/s (44%)
NVIDIA GeForce RTX 2080 Ti Founders Edition
117 MH/s (44%)
Crypto-Mining Ravencoin Hashrate (MH/s) - KawPow Hashrate
EVGA GeForce RTX 2080 Ti FTW3 Ultra Hybrid Gaming
34 MH/s (69%)
MSI GeForce RTX 2080 Ti Sea Hawk X
34 MH/s (69%)
MANLI GeForce RTX 2080Ti Gallardo (F398G+N504-00)
33 MH/s (67%)
ASUS ROG Strix GeForce RTX 2080 Ti
33 MH/s (67%)
NVIDIA GeForce RTX 2080 Ti Founders Edition
33 MH/s (67%)
Crypto-Mining Vertcoin Hashrate (MH/s) - Verthash Hashrate
Sapphire Nitro+ Radeon RX 6900 XT SE (Rev 2.0)
0.87 MH/s (45%)
KFA2 GeForce RTX 2080 Ti HOF 10th Anniversary Edition
0.87 MH/s (45%)
MANLI GeForce RTX 2080Ti Gallardo (F398G+N504-00)
0.86 MH/s (44%)
ASUS TUF GAMING Radeon RX 6900 XT OC
0.86 MH/s (44%)
AMD Radeon RX 6900 XT
0.86 MH/s (44%)
Popular Comparision
Gainward GeForce RTX 2080 SUPER Phantom GLH vs
MANLI GeForce RTX 2080Ti Gallardo (F398G+N504-00)
MANLI GeForce RTX 2080Ti Gallardo (F398G+N504-00) vs
MSI GeForce RTX 3070 Gaming X Trio 8G
MANLI GeForce RTX 2080Ti Gallardo (F398G+N504-00) vs
MSI GeForce RTX 3070 Ti GAMING X TRIO 8G
MANLI GeForce RTX 2080Ti Gallardo (F398G+N504-00) vs
MSI Radeon RX 5700 Mech OC
MANLI GeForce RTX 2080Ti Gallardo (F398G+N504-00) vs
INNO3D GeForce GTX 1650 GDDR6 COMPACT
Gainward GeForce RTX 3080 Phoenix V1 LHR vs
MANLI GeForce RTX 2080Ti Gallardo (F398G+N504-00)
ZOTAC GAMING GeForce RTX 2080 AMP MAXX vs
MANLI GeForce RTX 2080Ti Gallardo (F398G+N504-00)
ZOTAC Gaming GeForce RTX 3090 Trinity vs
MANLI GeForce RTX 2080Ti Gallardo (F398G+N504-00)
MANLI GeForce RTX 2080Ti Gallardo (F398G+N504-00) vs
Gainward GeForce RTX 3090 Phoenix GS
Palit GeForce RTX 3090 GamingPro OC vs
MANLI GeForce RTX 2080Ti Gallardo (F398G+N504-00)
MANLI GeForce RTX 2080Ti Gallardo (F398G+N504-00) vs
Sapphire Pulse Radeon RX 5600 XT BE
MANLI GeForce RTX 2080Ti Gallardo (F398G+N504-00) vs
GIGABYTE GeForce RTX 2080 SUPER Gaming 8G (Rev. 2.0)
ASUS Dual GeForce RTX 3060 vs
MANLI GeForce RTX 2080Ti Gallardo (F398G+N504-00)
MSI GeForce GTX 1650 D6 AERO ITX vs
MANLI GeForce RTX 2080Ti Gallardo (F398G+N504-00)
MSI GeForce RTX 3070 Ventus 3X 8G OC LHR vs
MANLI GeForce RTX 2080Ti Gallardo (F398G+N504-00)
MANLI GeForce RTX 2080Ti Gallardo (F398G+N504-00) vs
AMD Radeon RX 6900 XT
PowerColor Red Devil Radeon RX 6700 XT vs
MANLI GeForce RTX 2080Ti Gallardo (F398G+N504-00)
ASUS ROG Strix GeForce RTX 3060 OC Edition vs
MANLI GeForce RTX 2080Ti Gallardo (F398G+N504-00)