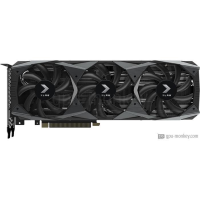
PNY GeForce RTX 2080 Ti XLR8 Gaming Overclocked Edition
PNY GeForce RTX 2080 Ti XLR8 Gaming Overclocked Edition melancarkan Q3/2018, yang berdasarkan seni bina NVIDIA GeForce RTX 2080 Ti. Ia akan datang dengan 11 GB memori GDDR6 lebar jalur tinggi.PNY GeForce RTX 2080 Ti XLR8 Gaming Overclocked Edition menampilkan 4352 shader, 88 render unit output, mempunyai jam rangsangan 1.635 GHz+ 6 % dan dilengkapi dengan cabutan kuasa 260 W + 4 % . GPU menyokong sehingga 4 monitor dengan resolusi 7680x4320 . Selain itu, jika anda sedang mencari Air cooling & Axial , ini adalah pilihan terbaik anda.
| Based on | NVIDIA GeForce RTX 2080 Ti |
| GPU Chip | TU102 |
| Unit pelaksanaan | 68 |
| Shader | 4352 |
| Render Output Units | 88 |
| Texture Units | 272 |
| Memory Size | 11 GB |
| Memory Type | GDDR6 |
| Memory Speed | 1.75 GHz |
| Memory Bandwith | 616 GB/s |
| Memory Interface | 352 bit |
Di manakah boleh dibeli?
Beli PNY GeForce RTX 2080 Ti XLR8 Gaming Overclocked Edition
Clock Speeds
| Base Clock | 1.350 GHz |
| Boost Clock | 1.635 GHz+ 6 % |
| Avg (Game) Clock | 1.545 GHz |
| Overclocking |
Yes |
Thermal Design
| TDP | 260 W+ 4 % |
| TDP (up) | -- |
| Tjunction max | -- |
| PCIe-Power | 2 x 8-Pin |
Cooler & Fans
| Fan-Type | Axial |
| Fan 1 | 2 x 90 mm |
| Fan 2 | -- |
-
| Cooler-Type | Air cooling |
| Noise (Idle) | 0 dB / Silent |
| Noise (Load): | -- |
Connectivity
| Max. Displays | 4 |
| HDCP-Version | 2.2 |
| HDMI Ports | 1x HDMI v2.0b |
| DP Ports | 3x DP v1.4a |
| DVI Ports | -- |
| VGA Ports | -- |
| USB-C Ports | -- |
Featureset
| Max. resolution | 7680x4320 |
| DirectX | 12_2 |
| Raytracing |
Yes |
| DLSS / FSR |
Yes |
| LED | No LED lighting |
Supported Video Codecs
| h264 | Decode / Encode |
| h265 / HEVC | Decode / Encode |
| AV1 |
No |
-
| VP8 | Decode |
| VP9 | Decode |
| Noise (Load): | -- |
Dimensions
| Length | 302 mm |
| Height | 114 mm |
| Width | 38 mm |
| Width (Slots) | 2 PCIe-Slots |
| Weight | -- |
Additional data
| GPU Interface | PCIe 3.0 x 16 |
| Tarikh keluaran | Q3/2018 |
| Release price | 1,199 $ |
| Structure size | 12 nm |
| Part-no | VCG2080T11TFMPB-O |
FP32 Performance (Single-precision TFLOPS) - FP32 (TFLOPS)
Gainward GeForce RTX 2080 Ti Phoenix
14.36 (36%)
EVGA GeForce RTX 2080 Ti XC2 Ultra Gaming
14.36 (36%)
MSI GeForce RTX 2080 Ti Ventus GP OC
14.23 (35%)
NVIDIA GeForce RTX 2080 Ti Founders Edition
14.23 (35%)
3DMark Benchmark - Time Spy (Performance) Graphics score
Colorful iGame GeForce RTX 3070 Vulcan OC-V
14472 (69%)
Colorful iGame GeForce RTX 3070 Vulcan OC LHR-V
14472 (69%)
MSI GeForce RTX 2080 Ti Ventus GP OC
14358 (69%)
NVIDIA GeForce RTX 2080 Ti Founders Edition
14358 (69%)
3DMark Benchmark - Fire Strike (Extreme) Graphics score
EVGA GeForce RTX 2080 Ti XC Ultra Gaming
16602 (56%)
Gainward GeForce RTX 2080 Ti Phoenix
16602 (56%)
MSI GeForce RTX 2080 Ti Ventus GP OC
16520 (56%)
NVIDIA GeForce RTX 2080 Ti Founders Edition
16520 (56%)
Battlefield 5 - 3840x2160 (2160p)
INNO3D GeForce RTX 2080 Ti GAMING OC X3
81 fps (avg) (68%)
MSI GeForce RTX 2080 Ti Duke 11G OC
81 fps (avg) (68%)
PNY GeForce RTX 2080 Ti XLR8 Gaming Overclocked Edition
80 fps (avg) (67%)
GIGABYTE GeForce RTX 3070 Eagle OC 8G
80 fps (avg) (67%)
MSI GeForce RTX 3070 Gaming Trio 8G
80 fps (avg) (67%)
Battlefield 5 - 2560x1440 (1440p)
MSI GeForce RTX 3070 Twin Fan 8G OC
138 fps (avg) (69%)
INNO3D GeForce RTX 2080 Ti GAMING OC X3
138 fps (avg) (69%)
PNY GeForce RTX 2080 Ti XLR8 Gaming Overclocked Edition
137 fps (avg) (68%)
MSI GeForce RTX 3070 Twin Fan 8G
137 fps (avg) (68%)
NVIDIA GeForce RTX 3070 Founders Edition
137 fps (avg) (68%)
Battlefield 5 - 1920x1080 (1080p)
ASUS ROG Strix GeForce RTX 2080 Ti OC
190 fps (avg) (94%)
MSI GeForce RTX 3070 Suprim X 8G LHR
190 fps (avg) (94%)
PNY GeForce RTX 2080 Ti XLR8 Gaming Overclocked Edition
189 fps (avg) (94%)
MSI GeForce RTX 3080 GAMING X TRIO 10G
189 fps (avg) (94%)
ASUS TUF Gaming GeForce RTX 3080 OC
189 fps (avg) (94%)
Shadow of the Tomb Raider - 3840x2160 (2160p)
Gainward GeForce RTX 2080 Ti Phoenix
58 fps (avg) (60%)
GIGABYTE AORUS GeForce RTX 2080 Ti Turbo 11G
58 fps (avg) (60%)
PNY GeForce RTX 2080 Ti XLR8 Gaming Overclocked Edition
57 fps (avg) (59%)
MSI GeForce RTX 2080 Ti Ventus GP OC
57 fps (avg) (59%)
NVIDIA GeForce RTX 2080 Ti Founders Edition
57 fps (avg) (59%)
Shadow of the Tomb Raider - 2560x1440 (1440p)
Palit GeForce RTX 2080 Ti GamingPro OC
109 fps (avg) (69%)
ASUS Dual GeForce RTX 2080 Ti OC
109 fps (avg) (69%)
PNY GeForce RTX 2080 Ti XLR8 Gaming Overclocked Edition
108 fps (avg) (68%)
MSI GeForce RTX 2080 Ti Ventus GP OC
108 fps (avg) (68%)
NVIDIA GeForce RTX 2080 Ti Founders Edition
108 fps (avg) (68%)
Shadow of the Tomb Raider - 1920x1080 (1080p)
MSI GeForce RTX 2080 Ti Duke 11G OC
146 fps (avg) (73%)
ASUS ROG Strix GeForce RTX 2080 Ti OC
146 fps (avg) (73%)
PNY GeForce RTX 2080 Ti XLR8 Gaming Overclocked Edition
145 fps (avg) (72%)
MSI GeForce RTX 3070 Suprim 8G
145 fps (avg) (72%)
MSI GeForce RTX 3070 Gaming X Trio 8G
145 fps (avg) (72%)
Crypto-Mining Ethereum Hashrate (MH/s) - Ethash Hashrate
MSI GeForce RTX 2080 Ti Duke 11G OC
60 MH/s (50%)
Colorful iGame GeForce RTX 2080 Ti Kudan-V
60 MH/s (50%)
PNY GeForce RTX 2080 Ti XLR8 Gaming Overclocked Edition
59 MH/s (49%)
ASUS ROG Strix GeForce RTX 2080 Ti
59 MH/s (49%)
NVIDIA GeForce RTX 2080 Ti Founders Edition
59 MH/s (49%)
Crypto-Mining Ergo Hashrate (MH/s) - Autolykos 2 Hashrate
MSI GeForce RTX 2080 Ti Gaming X Trio
118 MH/s (45%)
GALAX GeForce RTX 2080 Ti HOF 10th Anniversary Edition
118 MH/s (45%)
PNY GeForce RTX 2080 Ti XLR8 Gaming Overclocked Edition
117 MH/s (44%)
NVIDIA GeForce RTX 2080 Ti Founders Edition
117 MH/s (44%)
Crypto-Mining Ravencoin Hashrate (MH/s) - KawPow Hashrate
EVGA GeForce RTX 2080 Ti FTW3 Ultra Hybrid Gaming
34 MH/s (69%)
MSI GeForce RTX 2080 Ti Sea Hawk X
34 MH/s (69%)
PNY GeForce RTX 2080 Ti XLR8 Gaming Overclocked Edition
33 MH/s (67%)
ASUS ROG Strix GeForce RTX 2080 Ti
33 MH/s (67%)
NVIDIA GeForce RTX 2080 Ti Founders Edition
33 MH/s (67%)
Crypto-Mining Vertcoin Hashrate (MH/s) - Verthash Hashrate
Sapphire Nitro+ Radeon RX 6900 XT SE (Rev 2.0)
0.87 MH/s (45%)
KFA2 GeForce RTX 2080 Ti HOF 10th Anniversary Edition
0.87 MH/s (45%)
PNY GeForce RTX 2080 Ti XLR8 Gaming Overclocked Edition
0.86 MH/s (44%)
ASUS TUF GAMING Radeon RX 6900 XT OC
0.86 MH/s (44%)
AMD Radeon RX 6900 XT
0.86 MH/s (44%)
Perbandingan Popular
EVGA GeForce RTX 3080 FTW3 Ultra Hybrid Gaming vs
PNY GeForce RTX 2080 Ti XLR8 Gaming Overclocked Edition
PNY GeForce RTX 2080 Ti XLR8 Gaming Overclocked Edition vs
Colorful iGame GeForce RTX 3080 Vulcan OC 10G-V
PNY GeForce RTX 3060 Ti XLR8 Gaming Revel Epic-X RGB Edition vs
PNY GeForce RTX 2080 Ti XLR8 Gaming Overclocked Edition
EVGA GeForce GTX 1060 GAMING 3GB vs
PNY GeForce RTX 2080 Ti XLR8 Gaming Overclocked Edition
PNY GeForce RTX 2080 Ti XLR8 Gaming Overclocked Edition vs
MSI GeForce RTX 2060 VENTUS GP OC
MSI GeForce RTX 3090 Suprim X 24G vs
PNY GeForce RTX 2080 Ti XLR8 Gaming Overclocked Edition
GIGABYTE GeForce RTX 2070 Windforce 8G vs
PNY GeForce RTX 2080 Ti XLR8 Gaming Overclocked Edition
INNO3D GeForce GTX 1660 Ti TWIN X2 OC RGB vs
PNY GeForce RTX 2080 Ti XLR8 Gaming Overclocked Edition
PNY GeForce RTX 2080 Ti XLR8 Gaming Overclocked Edition vs
PNY GeForce RTX 2070 XLR8 Gaming Overclocked Edition (DVI)
PNY GeForce RTX 2080 Ti XLR8 Gaming Overclocked Edition vs
GIGABYTE GeForce RTX 2080 Ti Turbo 11G (Rev. 2.0)
MSI GeForce RTX 3080 VENTUS 3X 10G OC vs
PNY GeForce RTX 2080 Ti XLR8 Gaming Overclocked Edition
KFA2 GeForce RTX 3090 HOF Limited Edition vs
PNY GeForce RTX 2080 Ti XLR8 Gaming Overclocked Edition