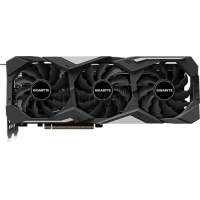
GIGABYTE GeForce RTX 2080 SUPER Windforce 8G
GIGABYTE GeForce RTX 2080 SUPER Windforce 8G запустил Q3/2019, основанный на архитектуре NVIDIA GeForce RTX 2080 SUPER. Он будет поставляться с 8 GB высокоскоростной памяти GDDR6.GIGABYTE GeForce RTX 2080 SUPER Windforce 8G включает 3072 , 64 , имеет тактовую частоту ускорения 1.815 GHz и потребляет 250 W . Графический процессор поддерживает до 4 мониторов с разрешением 7680x4320 . Кроме того, если вы ищете Air cooling охладителем & Axial вентилятора типа, это будет вашим лучшим выбором.
| Based on | NVIDIA GeForce RTX 2080 SUPER |
| GPU Chip | TU104 |
| Единицы исполнения | 48 |
| Шейдер | 3072 |
| Render Output Units | 64 |
| Texture Units | 192 |
| Memory Size | 8 GB |
| Memory Type | GDDR6 |
| Memory Speed | 1.938 GHz |
| Memory Bandwith | 496 GB/s |
| Memory Interface | 256 bit |
Где купить?
Купить GIGABYTE GeForce RTX 2080 SUPER Windforce 8G
Clock Speeds
| Base Clock | 1.650 GHz |
| Boost Clock | 1.815 GHz |
| Avg (Game) Clock | |
| Разгон |
Yes |
Thermal Design
| TDP | 250 W |
| TDP (up) | 280 W |
| Tjunction max | -- |
| PCIe-Power | 1 x 6-Pin, 1 x 8-Pin |
Cooler & Fans
| Fan-Type | Axial |
| Fan 1 | 3 x 82 mm |
| Fan 2 | -- |
-
| Cooler-Type | Air cooling |
| Noise (Idle) | 0 dB / Silent |
| Noise (Load): | 44 dB |
Connectivity
| Max. Displays | 4 |
| HDCP-Version | 2.2 |
| HDMI Ports | 1x HDMI v2.0b |
| DP Ports | 3x DP v1.4a |
| DVI Ports | -- |
| VGA Ports | -- |
| USB-C Ports | -- |
Featureset
| Max. resolution | 7680x4320 |
| DirectX | 12_2 |
| Raytracing |
Yes |
| DLSS / FSR |
Yes |
| LED | No LED lighting |
Supported Video Codecs
| h264 | Decode / Encode |
| h265 / HEVC | Decode / Encode |
| AV1 |
No |
-
| VP8 | Decode |
| VP9 | Decode |
| Noise (Load): | 44 dB |
Dimensions
| Length | 286 mm |
| Height | 114 mm |
| Width | 50 mm |
| Width (Slots) | 3 PCIe-Slots |
| Weight | -- |
Additional data
| GPU Interface | PCIe 3.0 x 16 |
| Дата выхода | Q3/2019 |
| Release price | 729 $ |
| Structure size | 12 nm |
| Part-no | GV-N208SWF3-8GD |
FP32 Performance (Single-precision TFLOPS) - FP32 (TFLOPS)
MSI GeForce RTX 2080 SUPER Ventus XS OC
11.24 (28%)
ZOTAC GAMING GeForce RTX 2080 AMP Extreme
11.22 (28%)
GIGABYTE GeForce RTX 2080 SUPER Windforce 8G
11.15 (28%)
MSI GeForce RTX 2080 SUPER Aero
11.15 (28%)
3DMark Benchmark - Time Spy (Performance) Graphics score
INNO3D GeForce RTX 2080 iCHILL FROSTBITE
11504 (55%)
MSI GeForce RTX 2080 Sea Hawk EK X
11504 (55%)
GIGABYTE GeForce RTX 2080 SUPER Windforce 8G
11490 (55%)
GALAX GeForce RTX 2080 SUPER
11490 (55%)
MSI GeForce RTX 2080 SUPER Aero
11490 (55%)
3DMark Benchmark - Fire Strike (Extreme) Graphics score
Colorful iGame GeForce GTX 1080 Ti Vulcan X OC-V
13204 (45%)
GIGABYTE GeForce RTX 2080 SUPER Windforce 8G
13181 (45%)
MANLI GeForce RTX 2080 SUPER (P1467+N502-00)
13181 (45%)
MSI GeForce RTX 2080 SUPER Aero
13181 (45%)
Battlefield 5 - 3840x2160 (2160p)
ASUS Dual GeForce RTX 3060 Ti OC V2 LHR
67 fps (avg) (56%)
GIGABYTE GeForce RTX 2080 SUPER Gaming OC Waterforce WB 8G
67 fps (avg) (56%)
GIGABYTE GeForce RTX 2080 SUPER Windforce 8G
66 fps (avg) (55%)
KFA2 GeForce RTX 3060 Ti (1-Click OC)
66 fps (avg) (55%)
INNO3D GeForce GTX 1080 Ti iCHILL X3
66 fps (avg) (55%)
Battlefield 5 - 2560x1440 (1440p)
GIGABYTE GeForce RTX 2080 SUPER Gaming OC Waterforce WB 8G
119 fps (avg) (59%)
ASUS Turbo GeForce RTX 2080 SUPER Evo
119 fps (avg) (59%)
GIGABYTE GeForce RTX 2080 SUPER Windforce 8G
118 fps (avg) (59%)
MSI GeForce RTX 2080 SUPER Ventus XS OC
118 fps (avg) (59%)
EVGA GeForce RTX 2080 SUPER FTW3
118 fps (avg) (59%)
Battlefield 5 - 1920x1080 (1080p)
GIGABYTE GeForce RTX 2080 SUPER Gaming OC Waterforce WB 8G
163 fps (avg) (81%)
ASUS Turbo GeForce RTX 2080 SUPER Evo
163 fps (avg) (81%)
GIGABYTE GeForce RTX 2080 SUPER Windforce 8G
162 fps (avg) (80%)
MSI GeForce RTX 2080 SUPER Ventus XS OC
162 fps (avg) (80%)
EVGA GeForce RTX 2080 SUPER FTW3
162 fps (avg) (80%)
Shadow of the Tomb Raider - 3840x2160 (2160p)
KFA2 GeForce RTX 3060 Ti (1-Click OC) LHR
47 fps (avg) (49%)
ASUS Turbo GeForce RTX 2080 SUPER Evo
47 fps (avg) (49%)
GIGABYTE GeForce RTX 2080 SUPER Windforce 8G
46 fps (avg) (48%)
EVGA GeForce RTX 2080 FTW3 ULTRA HYBRID GAMING
46 fps (avg) (48%)
MANLI GeForce RTX 2080 SUPER (P1467+N502-00)
46 fps (avg) (48%)
Shadow of the Tomb Raider - 2560x1440 (1440p)
Palit GeForce RTX 3070 GamingPro OC V1 LHR
91 fps (avg) (58%)
INNO3D GeForce RTX 3060 Ti Twin X2 LHR
91 fps (avg) (58%)
GIGABYTE GeForce RTX 2080 SUPER Windforce 8G
90 fps (avg) (57%)
GIGABYTE GeForce RTX 3070 Eagle 8G
90 fps (avg) (57%)
MANLI GeForce RTX 2080 SUPER (M3423+N502-00)
90 fps (avg) (57%)
Shadow of the Tomb Raider - 1920x1080 (1080p)
ASRock Radeon RX 6700 XT 12GB
128 fps (avg) (64%)
MSI GeForce RTX 2080 Gaming X Trio
128 fps (avg) (64%)
GIGABYTE GeForce RTX 2080 SUPER Windforce 8G
127 fps (avg) (63%)
EVGA GeForce RTX 2080 XC2 ULTRA
127 fps (avg) (63%)
EVGA GeForce RTX 2080 SUPER FTW3
127 fps (avg) (63%)
Crypto-Mining Ethereum Hashrate (MH/s) - Ethash Hashrate
MSI GeForce RTX 2080 Sea Hawk X
43 MH/s (36%)
Colorful iGame GeForce RTX 2080 Neptune OC-V
43 MH/s (36%)
GIGABYTE GeForce RTX 2080 SUPER Windforce 8G
42 MH/s (35%)
GALAX GeForce RTX 2070 SUPER EX (1-Click OC) White
42 MH/s (35%)
INNO3D GeForce RTX 2080 JET
42 MH/s (35%)
Crypto-Mining Ergo Hashrate (MH/s) - Autolykos 2 Hashrate
ASUS ROG Strix GeForce RTX 2060 SUPER EVO V2 OC Edition
83 MH/s (31%)
ASUS ROG Strix GeForce RTX 2080 SUPER OC
83 MH/s (31%)
GIGABYTE GeForce RTX 2080 SUPER Windforce 8G
82 MH/s (31%)
ASUS Turbo GeForce RTX 2070 SUPER EVO
82 MH/s (31%)
INNO3D GeForce RTX 2070 SUPER ICHILL FROSTBITE
82 MH/s (31%)
Crypto-Mining Ravencoin Hashrate (MH/s) - KawPow Hashrate
ASUS ROG Strix GeForce RTX 3070 White V2 LHR
29 MH/s (59%)
Palit GeForce RTX 3070 JetStream V1 LHR
29 MH/s (59%)
GIGABYTE GeForce RTX 2080 SUPER Windforce 8G
28 MH/s (57%)
ASUS ROG Strix GeForce RTX 2080 SUPER Advanced
28 MH/s (57%)
Colorful iGame GeForce RTX 2080 SUPER Advanced OC-V
28 MH/s (57%)
Crypto-Mining Vertcoin Hashrate (MH/s) - Verthash Hashrate
EVGA GeForce RTX 2080 XC ULTRA
0.61 MH/s (31%)
GIGABYTE GeForce RTX 2080 Gaming OC 8G
0.61 MH/s (31%)
KFA2 GeForce RTX 2080
0.6 MH/s (31%)
ASUS Dual GeForce RTX 2080 Evo
0.6 MH/s (31%)
ASUS Turbo GeForce RTX 2080 Evo
0.6 MH/s (31%)
Популярное сравнение
EVGA GeForce RTX 3080 FTW3 Ultra Hybrid Gaming vs
GIGABYTE GeForce RTX 2080 SUPER Windforce 8G
Gainward GeForce RTX 2080 Ti Phoenix vs
GIGABYTE GeForce RTX 2080 SUPER Windforce 8G
MSI GeForce RTX 2080 Ventus 8G OC vs
GIGABYTE GeForce RTX 2080 SUPER Windforce 8G
ASUS ROG STRIX Radeon RX 6700 XT OC Edition vs
GIGABYTE GeForce RTX 2080 SUPER Windforce 8G
GALAX GeForce RTX 2080 Ti SG Edition vs
GIGABYTE GeForce RTX 2080 SUPER Windforce 8G
Colorful GeForce GT 1030 2G V3-V vs
GIGABYTE GeForce RTX 2080 SUPER Windforce 8G
ASUS TUF Gaming GeForce RTX 3060 OC Edition vs
GIGABYTE GeForce RTX 2080 SUPER Windforce 8G
Palit GeForce GTX 1660 StormX OC vs
GIGABYTE GeForce RTX 2080 SUPER Windforce 8G
GIGABYTE GeForce GT 1030 Low Profile D4 2G DDR4 vs
GIGABYTE GeForce RTX 2080 SUPER Windforce 8G
GIGABYTE AORUS GeForce RTX 2080 SUPER Waterforce 8G vs
GIGABYTE GeForce RTX 2080 SUPER Windforce 8G
ASUS EKWB GeForce RTX 3080 vs
GIGABYTE GeForce RTX 2080 SUPER Windforce 8G
EVGA GeForce RTX 2080 SUPER XC Gaming vs
GIGABYTE GeForce RTX 2080 SUPER Windforce 8G
GIGABYTE GeForce RTX 2080 SUPER Gaming OC 8G (Rev. 2.0) vs
GIGABYTE GeForce RTX 2080 SUPER Windforce 8G
PNY GeForce RTX 2060 SUPER 8GB XLR8 Gaming Overclocked Edition vs
GIGABYTE GeForce RTX 2080 SUPER Windforce 8G
GIGABYTE GeForce RTX 2080 Windforce 8G vs
GIGABYTE GeForce RTX 2080 SUPER Windforce 8G
ASUS Dual GeForce RTX 3060 Ti vs
GIGABYTE GeForce RTX 2080 SUPER Windforce 8G
GIGABYTE GeForce RTX 2080 SUPER Windforce 8G vs
EVGA GeForce GTX 1080 HYBRID GAMING
MSI Radeon RX 580 Armor MK2 8G OC vs
GIGABYTE GeForce RTX 2080 SUPER Windforce 8G
GIGABYTE GeForce RTX 2080 SUPER Windforce 8G vs
GALAX GeForce RTX 3070 Ti (1-Click OC)