Gainward GeForce RTX 2070 SUPER Phoenix V1
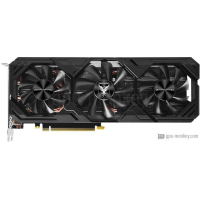
Gainward GeForce RTX 2070 SUPER Phoenix V1 เปิดตัว Q3/2020 ซึ่งอิงตามสถาปัตยกรรม NVIDIA GeForce RTX 2070 SUPER โดยจะมาพร้อม 8 GB ของหน่วยความจำ GDDR6 แบนด์วิดท์สูงGainward GeForce RTX 2070 SUPER Phoenix V1 มีคุณสมบัติ 2560 shader, 64 เอาต์พุตหน่วยแสดงผล มีนาฬิกา 1.770 GHz และมาพร้อมกับการดึงพลังงาน 235 W + 9 % GPU รองรับ 4 มีความละเอียด 7680x4320 นอกจากนี้ หากคุณกำลังมองหา Air cooling cooler & Axial fan-type จะเป็นตัวเลือกที่ดีที่สุดของคุณ
| Based on | NVIDIA GeForce RTX 2070 SUPER |
| GPU Chip | TU104 |
| หน่วยปฏิบัติการ | 40 |
| เชเดอร์ | 2560 |
| Render Output Units | 64 |
| Texture Units | 160 |
| Memory Size | 8 GB |
| Memory Type | GDDR6 |
| Memory Speed | 1.75 GHz |
| Memory Bandwith | 448 GB/s |
| Memory Interface | 256 bit |
ซื้อที่ไหน?
ซื้อ Gainward GeForce RTX 2070 SUPER Phoenix V1
Clock Speeds
| Base Clock | 1.605 GHz |
| Boost Clock | 1.770 GHz |
| Avg (Game) Clock | |
| โอเวอร์คล็อก |
Yes |
Thermal Design
| TDP | 235 W+ 9 % |
| TDP (up) | -- |
| Tjunction max | 88 °C |
| PCIe-Power | 1 x 6-Pin, 1 x 8-Pin |
Cooler & Fans
| Fan-Type | Axial |
| Fan 1 | 3 x 80 mm |
| Fan 2 | -- |
-
| Cooler-Type | Air cooling |
| Noise (Idle) | 0 dB / Silent |
| Noise (Load): | -- |
Connectivity
| Max. Displays | 4 |
| HDCP-Version | 2.2 |
| HDMI Ports | 1x HDMI v2.0b |
| DP Ports | 3x DP v1.4a |
| DVI Ports | -- |
| VGA Ports | -- |
| USB-C Ports | -- |
Featureset
| Max. resolution | 7680x4320 |
| DirectX | 12_2 |
| Raytracing |
Yes |
| DLSS / FSR |
Yes |
| LED | No LED lighting |
Supported Video Codecs
| h264 | Decode / Encode |
| h265 / HEVC | Decode / Encode |
| AV1 |
No |
-
| VP8 | Decode |
| VP9 | Decode |
| Noise (Load): | -- |
Dimensions
| Length | 288 mm |
| Height | 112 mm |
| Width | -- |
| Width (Slots) | 3 PCIe-Slots |
| Weight | -- |
Additional data
| GPU Interface | PCIe 3.0 x 16 |
| วันที่วางจำหน่าย | Q3/2020 |
| Release price | -- |
| Structure size | 12 nm |
| Part-no | 471056224-1730 |
FP32 Performance (Single-precision TFLOPS) - FP32 (TFLOPS)
GIGABYTE GeForce GTX 1080 Mini ITX 8G
9.07 (23%)
ASUS ROG Strix GeForce GTX 1080
9.07 (23%)
Gainward GeForce RTX 2070 SUPER Phoenix V1
9.06 (22%)
MSI GeForce RTX 2070 SUPER GAMING TRIO
9.06 (22%)
MSI GeForce RTX 2070 SUPER ARMOR
9.06 (22%)
3DMark Benchmark - Time Spy (Performance) Graphics score
MSI GeForce GTX 1080 Ti LIGHTNING
10010 (48%)
ASUS ROG Strix GeForce GTX 1080 Ti
10010 (48%)
Gainward GeForce RTX 2070 SUPER Phoenix V1
9987 (48%)
EVGA GeForce RTX 2070 SUPER
9987 (48%)
MSI GeForce RTX 2070 SUPER VENTUS GP
9987 (48%)
3DMark Benchmark - Fire Strike (Extreme) Graphics score
Palit GeForce RTX 2070 GameRock Premium
11711 (40%)
GIGABYTE AORUS GeForce RTX 2070 XTREME 8G
11711 (40%)
Gainward GeForce RTX 2070 SUPER Phoenix V1
11649 (39%)
MSI GeForce RTX 2070 SUPER GAMING TRIO
11649 (39%)
MSI GeForce RTX 2070 SUPER ARMOR
11649 (39%)
Battlefield 5 - 3840x2160 (2160p)
MSI GeForce RTX 3060 GAMING X Trio 12G
55 fps (avg) (46%)
MSI GeForce RTX 3060 GAMING X 12G
55 fps (avg) (46%)
Gainward GeForce RTX 2070 SUPER Phoenix V1
54 fps (avg) (45%)
ZOTAC GAMING GeForce RTX 3060 Twin Edge
54 fps (avg) (45%)
ZOTAC GAMING GeForce RTX 3060 Twin Edge OC
54 fps (avg) (45%)
Battlefield 5 - 2560x1440 (1440p)
MSI GeForce RTX 2070 SUPER GAMING X TRIO
99 fps (avg) (49%)
ASUS ROG Strix GeForce RTX 2070 OC
99 fps (avg) (49%)
Gainward GeForce RTX 2070 SUPER Phoenix V1
98 fps (avg) (49%)
MSI GeForce RTX 2070 GAMING Z 8G
98 fps (avg) (49%)
GIGABYTE AORUS GeForce RTX 2070 XTREME 8G
98 fps (avg) (49%)
Battlefield 5 - 1920x1080 (1080p)
EVGA GeForce RTX 2070 SUPER FTW3 ULTRA
131 fps (avg) (65%)
MSI GeForce RTX 2070 SUPER GAMING Z TRIO
131 fps (avg) (65%)
Gainward GeForce RTX 2070 SUPER Phoenix V1
130 fps (avg) (64%)
MSI GeForce RTX 2070 SUPER ARMOR
130 fps (avg) (64%)
ZOTAC GAMING GeForce RTX 2070 AMP Extreme
130 fps (avg) (64%)
Shadow of the Tomb Raider - 3840x2160 (2160p)
MSI GeForce RTX 2070 SUPER GAMING X
41 fps (avg) (43%)
MSI GeForce RTX 2070 SUPER GAMING X TRIO
41 fps (avg) (43%)
Gainward GeForce RTX 2070 SUPER Phoenix V1
40 fps (avg) (42%)
MSI GeForce RTX 2070 SUPER GAMING TRIO
40 fps (avg) (42%)
MSI GeForce RTX 2070 SUPER ARMOR
40 fps (avg) (42%)
Shadow of the Tomb Raider - 2560x1440 (1440p)
ZOTAC GAMING GeForce RTX 3060 Twin Edge
79 fps (avg) (50%)
ZOTAC GAMING GeForce RTX 3060 Twin Edge OC
79 fps (avg) (50%)
Gainward GeForce RTX 2070 SUPER Phoenix V1
78 fps (avg) (49%)
MSI GeForce RTX 2070 SUPER GAMING TRIO
78 fps (avg) (49%)
MSI GeForce RTX 2070 SUPER ARMOR
78 fps (avg) (49%)
Shadow of the Tomb Raider - 1920x1080 (1080p)
ASUS TUF Gaming GeForce RTX 3060 OC Edition
116 fps (avg) (58%)
ZOTAC GAMING GeForce RTX 3060 AMP White Edition
116 fps (avg) (58%)
Gainward GeForce RTX 2070 SUPER Phoenix V1
115 fps (avg) (57%)
MSI GeForce RTX 3060 GAMING X Trio 12G
115 fps (avg) (57%)
MSI GeForce RTX 3060 GAMING X 12G
115 fps (avg) (57%)
Crypto-Mining Ethereum Hashrate (MH/s) - Ethash Hashrate
ASUS Dual GeForce RTX 2080 OC
43 MH/s (36%)
ASUS Dual GeForce RTX 2080 OC Evo
43 MH/s (36%)
Gainward GeForce RTX 2070 SUPER Phoenix V1
42 MH/s (35%)
ASUS ROG Strix GeForce RTX 2080 SUPER OC White
42 MH/s (35%)
NVIDIA GeForce RTX 2080 SUPER Founders Edition
42 MH/s (35%)
Crypto-Mining Ergo Hashrate (MH/s) - Autolykos 2 Hashrate
ASUS Dual GeForce RTX 2080 SUPER OC Evo V2
83 MH/s (31%)
ASUS ROG Strix GeForce RTX 2080 SUPER OC White
83 MH/s (31%)
Gainward GeForce RTX 2070 SUPER Phoenix V1
82 MH/s (31%)
ASUS Dual GeForce RTX 2080 SUPER Evo V2
82 MH/s (31%)
NVIDIA GeForce RTX 2080 SUPER Founders Edition
82 MH/s (31%)
Crypto-Mining Ravencoin Hashrate (MH/s) - KawPow Hashrate
ASUS ROG Strix GeForce RTX 3060 Ti OC
23 MH/s (47%)
MSI GeForce RTX 3060 Ti Gaming X Trio 8G
23 MH/s (47%)
Gainward GeForce RTX 2070 SUPER Phoenix V1
22 MH/s (45%)
MSI GeForce RTX 3060 Ti Gaming Trio 8G
22 MH/s (45%)
NVIDIA GeForce RTX 3060 Ti Founders Edition
22 MH/s (45%)
Crypto-Mining Vertcoin Hashrate (MH/s) - Verthash Hashrate
MSI GeForce RTX 2070 ARMOR 8G OC
0.59 MH/s (30%)
ZOTAC GAMING GeForce RTX 2070 AMP
0.59 MH/s (30%)
GIGABYTE GeForce RTX 2070 Windforce 8G (rev. 2.0)
0.58 MH/s (30%)
ASUS Dual GeForce RTX 2070 Mini
0.58 MH/s (30%)
ASUS Dual GeForce RTX 2070 Evo V2
0.58 MH/s (30%)
การเปรียบเทียบยอดนิยม
ASUS Turbo GeForce RTX 2070 vs
Gainward GeForce RTX 2070 SUPER Phoenix V1
Palit GeForce RTX 2070 SUPER X vs
Gainward GeForce RTX 2070 SUPER Phoenix V1
MSI Radeon RX 580 Gaming 8G vs
Gainward GeForce RTX 2070 SUPER Phoenix V1
Gainward GeForce RTX 2070 SUPER Phoenix V1 vs
NVIDIA GeForce RTX 2060 Founders Edition
ASUS TUF Gaming Radeon RX 6800 XT OC vs
Gainward GeForce RTX 2070 SUPER Phoenix V1
MSI Radeon RX 580 Gaming+ 8G vs
Gainward GeForce RTX 2070 SUPER Phoenix V1
ASRock Radeon RX 5600 XT Challenger D 6G OC vs
Gainward GeForce RTX 2070 SUPER Phoenix V1
MSI GeForce GTX 1660 SUPER AERO ITX OC vs
Gainward GeForce RTX 2070 SUPER Phoenix V1
Palit GeForce RTX 3090 GamingPro OC vs
Gainward GeForce RTX 2070 SUPER Phoenix V1
Gainward GeForce RTX 2070 SUPER Phoenix V1 vs
PowerColor Radeon RX 5700 XT Red Devil