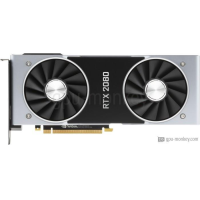
NVIDIA GeForce RTX 2080 Founders Edition
NVIDIA GeForce RTX 2080 Founders Edition đã ra mắt Q3/2018, dựa trên kiến trúc NVIDIA GeForce RTX 2080. Nó sẽ đi kèm với 8 GB của bộ nhớ GDDR6 băng thông cao.NVIDIA GeForce RTX 2080 Founders Edition có tính năng 2944 đổ bóng, đơn vị đầu ra hiển thị 64 1.800 GHz+ 5 % và được trang bị sức mạnh 225 W + 5 % . GPU hỗ trợ tối đa 4 màn hình có độ phân giải 7680x4320 . Ngoài ra, nếu bạn đang tìm kiếm loại Air cooling & Axial thì đây sẽ là lựa chọn tốt nhất của bạn.
| Based on | NVIDIA GeForce RTX 2080 |
| GPU Chip | TU104 |
| Đơn vị thi công | 46 |
| Shader | 2944 |
| Render Output Units | 64 |
| Texture Units | 184 |
| Memory Size | 8 GB |
| Memory Type | GDDR6 |
| Memory Speed | 1.938 GHz |
| Memory Bandwith | 496 GB/s |
| Memory Interface | 256 bit |
Nơi để mua?
Mua NVIDIA GeForce RTX 2080 Founders Edition
Clock Speeds
| Base Clock | 1.515 GHz |
| Boost Clock | 1.800 GHz+ 5 % |
| Avg (Game) Clock | |
| Ép xung |
Yes |
Thermal Design
| TDP | 225 W+ 5 % |
| TDP (up) | 250 W+ 5 % |
| Tjunction max | 89 °C |
| PCIe-Power | 1 x 6-Pin, 1 x 8-Pin |
Cooler & Fans
| Fan-Type | Axial |
| Fan 1 | 2 x 90 mm |
| Fan 2 | -- |
-
| Cooler-Type | Air cooling |
| Noise (Idle) | 35 dB |
| Noise (Load): | 41 dB |
Connectivity
| Max. Displays | 4 |
| HDCP-Version | 2.2 |
| HDMI Ports | 1x HDMI v2.0b |
| DP Ports | 3x DP v1.4a |
| DVI Ports | -- |
| VGA Ports | -- |
| USB-C Ports | 1 |
Featureset
| Max. resolution | 7680x4320 |
| DirectX | 12_2 |
| Raytracing |
Yes |
| DLSS / FSR |
Yes |
| LED | No LED lighting |
Supported Video Codecs
| h264 | Decode / Encode |
| h265 / HEVC | Decode / Encode |
| AV1 |
No |
-
| VP8 | Decode |
| VP9 | Decode |
| Noise (Load): | 41 dB |
Dimensions
| Length | 267 mm |
| Height | 116 mm |
| Width | -- |
| Width (Slots) | 2 PCIe-Slots |
| Weight | -- |
Additional data
| GPU Interface | PCIe 3.0 x 16 |
| Ngày phát hành | Q3/2018 |
| Release price | 729 $ |
| Structure size | 12 nm |
| Part-no | -- |
FP32 Performance (Single-precision TFLOPS) - FP32 (TFLOPS)
ASRock Radeon RX 6600 XT Challenger ITX 8GB
10.61 (26%)
MSI Radeon RX 6600 XT GAMING 8G
10.61 (26%)
NVIDIA GeForce RTX 2080 Founders Edition
10.6 (26%)
GIGABYTE GeForce RTX 2080 Windforce OC 8G
10.6 (26%)
MSI GeForce RTX 2080 Ventus 8G OC
10.6 (26%)
3DMark Benchmark - Time Spy (Performance) Graphics score
Palit GeForce RTX 2080 GameRock
11365 (54%)
Palit GeForce RTX 2080 GamingPro OC
11365 (54%)
NVIDIA GeForce RTX 2080 Founders Edition
11307 (54%)
GIGABYTE GeForce RTX 2080 Windforce OC 8G
11307 (54%)
MSI GeForce RTX 2080 Ventus 8G OC
11307 (54%)
3DMark Benchmark - Fire Strike (Extreme) Graphics score
EVGA GeForce GTX 1080 Ti FTW3 GAMING
13065 (44%)
AMD Radeon Pro VII
13060 (44%)
NVIDIA GeForce RTX 2080 Founders Edition
13053 (44%)
GIGABYTE GeForce RTX 2080 Windforce OC 8G
13053 (44%)
MSI GeForce RTX 2080 Ventus 8G OC
13053 (44%)
Battlefield 5 - 3840x2160 (2160p)
ASUS Dual GeForce RTX 2080 OC Evo
63 fps (avg) (53%)
ASUS Dual GeForce RTX 2080 OC
63 fps (avg) (53%)
NVIDIA GeForce RTX 2080 Founders Edition
62 fps (avg) (52%)
MSI GeForce RTX 2080 Ventus 8G OC
62 fps (avg) (52%)
ASUS ROG Strix GeForce RTX 2080 Advanced
62 fps (avg) (52%)
Battlefield 5 - 2560x1440 (1440p)
ASUS Dual GeForce RTX 2080 OC Evo
115 fps (avg) (57%)
ASUS Dual GeForce RTX 2080 OC
115 fps (avg) (57%)
NVIDIA GeForce RTX 2080 Founders Edition
114 fps (avg) (57%)
GIGABYTE GeForce RTX 2080 Turbo OC 8G
114 fps (avg) (57%)
MSI GeForce RTX 2080 Ventus 8G OC
114 fps (avg) (57%)
Battlefield 5 - 1920x1080 (1080p)
GALAX GeForce RTX 2080 GAMER
159 fps (avg) (79%)
MSI GeForce RTX 2080 Gaming X Trio
159 fps (avg) (79%)
NVIDIA GeForce RTX 2080 Founders Edition
158 fps (avg) (78%)
GIGABYTE GeForce RTX 2080 Windforce OC 8G
158 fps (avg) (78%)
MSI GeForce RTX 2080 Ventus 8G OC
158 fps (avg) (78%)
Shadow of the Tomb Raider - 3840x2160 (2160p)
ZOTAC GAMING GeForce RTX 2080 AMP
46 fps (avg) (48%)
GALAX GeForce RTX 2080 EX OC White
46 fps (avg) (48%)
NVIDIA GeForce RTX 2080 Founders Edition
45 fps (avg) (47%)
ASUS ROG Strix GeForce RTX 3060 OC Edition
45 fps (avg) (47%)
ZOTAC GAMING GeForce RTX 3060 AMP White Edition
45 fps (avg) (47%)
Shadow of the Tomb Raider - 2560x1440 (1440p)
EVGA GeForce RTX 2080 XC ULTRA
85 fps (avg) (54%)
Gainward GeForce RTX 2080 Phantom GS
85 fps (avg) (54%)
NVIDIA GeForce RTX 2080 Founders Edition
84 fps (avg) (53%)
GIGABYTE GeForce RTX 2080 Turbo OC 8G
84 fps (avg) (53%)
MSI GeForce RTX 2080 Ventus 8G OC
84 fps (avg) (53%)
Shadow of the Tomb Raider - 1920x1080 (1080p)
GALAX GeForce RTX 2080 SUPER Work The Frames Edition
128 fps (avg) (64%)
INNO3D GeForce RTX 2080 iCHILL FROSTBITE
128 fps (avg) (64%)
NVIDIA GeForce RTX 2080 Founders Edition
127 fps (avg) (63%)
MSI GeForce RTX 3060 Ti Ventus 2X 8G OCV1
127 fps (avg) (63%)
MSI GeForce RTX 3060 Ti Ventus 3X 8G OC
127 fps (avg) (63%)
Crypto-Mining Ethereum Hashrate (MH/s) - Ethash Hashrate
ASUS Dual GeForce RTX 2080 OC Evo
43 MH/s (36%)
ASUS Dual GeForce RTX 2080 OC
43 MH/s (36%)
NVIDIA GeForce RTX 2080 Founders Edition
42 MH/s (35%)
ASUS ROG Strix GeForce RTX 2080 SUPER OC White
42 MH/s (35%)
NVIDIA GeForce RTX 2080 SUPER Founders Edition
42 MH/s (35%)
Crypto-Mining Ergo Hashrate (MH/s) - Autolykos 2 Hashrate
ASUS ROG Strix GeForce RTX 2080 OC
79 MH/s (30%)
GIGABYTE AORUS GeForce RTX 2080 Xtreme Waterforce 8G
79 MH/s (30%)
NVIDIA GeForce RTX 2080 Founders Edition
78 MH/s (30%)
ASUS Dual GeForce RTX 2080 OC
78 MH/s (30%)
ASUS Dual GeForce RTX 2080 OC Evo
78 MH/s (30%)
Crypto-Mining Ravencoin Hashrate (MH/s) - KawPow Hashrate
PowerColor Radeon RX 6800
28 MH/s (57%)
EVGA GeForce RTX 2080 SUPER Gaming
28 MH/s (57%)
NVIDIA GeForce RTX 2080 Founders Edition
27 MH/s (55%)
ASUS Dual GeForce RTX 2080 Evo
27 MH/s (55%)
ASUS Turbo GeForce RTX 2080 Evo
27 MH/s (55%)
Crypto-Mining Vertcoin Hashrate (MH/s) - Verthash Hashrate
INNO3D GeForce RTX 2080 iCHILL FROSTBITE
0.62 MH/s (32%)
EVGA GeForce RTX 2080 FTW3 ULTRA HYDRO COPPER GAMING
0.62 MH/s (32%)
NVIDIA GeForce RTX 2080 Founders Edition
0.61 MH/s (31%)
ASUS Dual GeForce RTX 2080 OC
0.61 MH/s (31%)
ASUS Dual GeForce RTX 2080 OC Evo
0.61 MH/s (31%)
So sánh phổ biến
MSI GeForce RTX 3070 Ventus 2X 8G vs
NVIDIA GeForce RTX 2080 Founders Edition
NVIDIA GeForce RTX 2080 Founders Edition vs
EVGA GeForce RTX 3080 XC3 Ultra Gaming
NVIDIA GeForce RTX 2080 Founders Edition vs
Palit GeForce RTX 3060 StormX OC
NVIDIA GeForce RTX 3060 Ti Founders Edition vs
NVIDIA GeForce RTX 2080 Founders Edition
ZOTAC Gaming GeForce RTX 3070 Twin Edge OC vs
NVIDIA GeForce RTX 2080 Founders Edition
NVIDIA GeForce RTX 2080 Founders Edition vs
INNO3D GeForce RTX 2070 SUPER GAMING OC X3
GIGABYTE GeForce RTX 2070 Windforce 8G vs
NVIDIA GeForce RTX 2080 Founders Edition
NVIDIA GeForce RTX 2080 Founders Edition vs
INNO3D GeForce RTX 3090 iCHILL X4
NVIDIA GeForce RTX 2080 Founders Edition vs
AMD Radeon RX 6800 XT
NVIDIA GeForce RTX 2080 Founders Edition vs
Palit GeForce RTX 2060 SUPER DUAL V1
KFA2 GeForce RTX 2070 EX OC vs
NVIDIA GeForce RTX 2080 Founders Edition
NVIDIA GeForce RTX 2080 Founders Edition vs
ASUS Dual Radeon RX 5600 XT Top Evo
NVIDIA GeForce RTX 2080 Founders Edition vs
GIGABYTE GeForce RTX 3070 Eagle 8G
Sapphire Nitro+ Radeon RX 6800 XT SE vs
NVIDIA GeForce RTX 2080 Founders Edition
ASUS Dual GeForce RTX 2060 OC Edition EVO vs
NVIDIA GeForce RTX 2080 Founders Edition
NVIDIA GeForce RTX 2080 Founders Edition vs
PowerColor Radeon RX 5700 XT
NVIDIA GeForce RTX 2080 Founders Edition vs
GALAX GeForce RTX 2080 SUPER EX Gamer
ASUS ROG Poseidon GeForce GTX 1080 Ti Platinum edition vs
NVIDIA GeForce RTX 2080 Founders Edition
NVIDIA GeForce RTX 2080 Founders Edition vs
NVIDIA GeForce RTX 2080 SUPER Founders Edition
Gainward GeForce GTX 1080 Ti Founders Edition vs
NVIDIA GeForce RTX 2080 Founders Edition
ASUS ROG Strix GeForce RTX 3070 Ti vs
NVIDIA GeForce RTX 2080 Founders Edition
NVIDIA GeForce RTX 2080 Founders Edition vs
MSI GeForce RTX 3060 Ti Ventus 3X 8G OC LHR
NVIDIA GeForce RTX 2080 Founders Edition vs
MSI GeForce RTX 2080 Duke 8G OC
NVIDIA GeForce RTX 3090 Founders Edition vs
NVIDIA GeForce RTX 2080 Founders Edition
KFA2 GeForce GTX 1070 EX vs
NVIDIA GeForce RTX 2080 Founders Edition