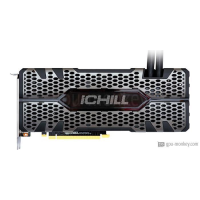
INNO3D GeForce RTX 2070 SUPER ICHILL BLACK
INNO3D GeForce RTX 2070 SUPER ICHILL BLACK推出了基于NVIDIA GeForce RTX 2070 SUPER架构的Q3/2019。它将配备高带宽 GDDR6 内存的 8 GB。该INNO3D GeForce RTX 2070 SUPER ICHILL BLACK功能2560着色, 64渲染输出单元,具有升压时钟1.905 GHz+ 8 %并配备了一个电源吸取的255 W + 19 % 。 GPU 最多支持4分辨率为7680x4320显示器。此外,如果您正在寻找AIO water cooling散热器和Axial风扇类型,这将是您的最佳选择。
| Based on | NVIDIA GeForce RTX 2070 SUPER |
| GPU Chip | TU104 |
| 执行单位 | 40 |
| 着色器 | 2560 |
| Render Output Units | 64 |
| Texture Units | 160 |
| Memory Size | 8 GB |
| Memory Type | GDDR6 |
| Memory Speed | 1.75 GHz |
| Memory Bandwith | 448 GB/s |
| Memory Interface | 256 bit |
Clock Speeds
| Base Clock | 1.605 GHz |
| Boost Clock | 1.905 GHz+ 8 % |
| Avg (Game) Clock | |
| 超频 |
Yes |
Thermal Design
| TDP | 255 W+ 19 % |
| TDP (up) | -- |
| Tjunction max | 88 °C |
| PCIe-Power | 1 x 6-Pin, 1 x 8-Pin |
Cooler & Fans
| Fan-Type | Axial |
| Fan 1 | 2 x 120 mm |
| Fan 2 | -- |
-
| Cooler-Type | AIO water cooling |
| Noise (Idle) | 0 dB / Silent |
| Noise (Load): | -- |
Connectivity
| Max. Displays | 4 |
| HDCP-Version | 2.2 |
| HDMI Ports | 1x HDMI v2.0b |
| DP Ports | 3x DP v1.4a |
| DVI Ports | -- |
| VGA Ports | -- |
| USB-C Ports | -- |
Featureset
| Max. resolution | 7680x4320 |
| DirectX | 12_2 |
| Raytracing |
Yes |
| DLSS / FSR |
Yes |
| LED | No LED lighting |
Supported Video Codecs
| h264 | Decode / Encode |
| h265 / HEVC | Decode / Encode |
| AV1 |
No |
-
| VP8 | Decode |
| VP9 | Decode |
| Noise (Load): | -- |
Dimensions
| Length | 272 mm |
| Height | 112 mm |
| Width | -- |
| Width (Slots) | 2 PCIe-Slots |
| Weight | -- |
Additional data
| GPU Interface | PCIe 3.0 x 16 |
| 发布日期 | Q3/2019 |
| Release price | -- |
| Structure size | 12 nm |
| Part-no | C207SB-08D6X-11800004 |
FP32 Performance (Single-precision TFLOPS) - FP32 (TFLOPS)
ZOTAC GeForce GTX 1080 AMP Extreme
9.78 (24%)
MSI GeForce GTX 1080 GAMING Z 8G
9.78 (24%)
INNO3D GeForce RTX 2070 SUPER ICHILL BLACK
9.75 (24%)
MSI Radeon RX 5700 XT Gaming
9.75 (24%)
GIGABYTE AORUS GeForce RTX 2070 SUPER 8G
9.75 (24%)
3DMark Benchmark - Time Spy (Performance) Graphics score
NVIDIA GeForce RTX 3080 Laptop (Mobile) - 130 W
10600 (51%)
ASUS ROG Strix GeForce RTX 2070 SUPER OC
10439 (50%)
INNO3D GeForce RTX 2070 SUPER ICHILL BLACK
10365 (50%)
GIGABYTE AORUS GeForce RTX 2070 SUPER 8G
10365 (50%)
3DMark Benchmark - Fire Strike (Extreme) Graphics score
MSI Radeon RX 5700 XT Gaming X
12438 (42%)
ASUS ROG Strix GeForce RTX 2070 SUPER OC
12388 (42%)
INNO3D GeForce RTX 2070 SUPER ICHILL BLACK
12297 (42%)
GIGABYTE AORUS GeForce RTX 2070 SUPER 8G
12297 (42%)
Battlefield 5 - 3840x2160 (2160p)
MSI Radeon RX 5700 XT Gaming
58 fps (avg) (49%)
MSI Radeon RX 5700 XT Mech OC
58 fps (avg) (49%)
INNO3D GeForce RTX 2070 SUPER ICHILL BLACK
57 fps (avg) (48%)
ZOTAC GAMING GeForce RTX 2070 AMP Extreme
57 fps (avg) (48%)
ASUS ROG Strix GeForce RTX 2070 OC
57 fps (avg) (48%)
Battlefield 5 - 2560x1440 (1440p)
MSI GeForce RTX 3060 GAMING X Trio 12G
102 fps (avg) (51%)
ZOTAC GAMING GeForce RTX 3060 AMP White Edition
102 fps (avg) (51%)
INNO3D GeForce RTX 2070 SUPER ICHILL BLACK
101 fps (avg) (50%)
MSI GeForce RTX 3060 VENTUS 2X 12G OC
101 fps (avg) (50%)
ZOTAC GAMING GeForce RTX 3060 Twin Edge OC
101 fps (avg) (50%)
Battlefield 5 - 1920x1080 (1080p)
NVIDIA GeForce RTX 3070 Laptop (Mobile) - 125 W
133 fps (avg) (66%)
ASUS ROG Strix GeForce RTX 2070 SUPER OC
133 fps (avg) (66%)
INNO3D GeForce RTX 2070 SUPER ICHILL BLACK
132 fps (avg) (65%)
ASUS Dual GeForce RTX 2070 SUPER EVO OC
132 fps (avg) (65%)
GIGABYTE AORUS GeForce RTX 2070 SUPER 8G
132 fps (avg) (65%)
Shadow of the Tomb Raider - 3840x2160 (2160p)
MSI GeForce RTX 3060 GAMING X Trio 12G
44 fps (avg) (46%)
MSI GeForce RTX 3060 GAMING X 12G
44 fps (avg) (46%)
INNO3D GeForce RTX 2070 SUPER ICHILL BLACK
43 fps (avg) (45%)
ZOTAC GAMING GeForce RTX 3060 Twin Edge
43 fps (avg) (45%)
ZOTAC GAMING GeForce RTX 3060 Twin Edge OC
43 fps (avg) (45%)
Shadow of the Tomb Raider - 2560x1440 (1440p)
EVGA GeForce RTX 3060 XC Gaming
81 fps (avg) (51%)
ASUS TUF Gaming GeForce RTX 3060 OC Edition
81 fps (avg) (51%)
INNO3D GeForce RTX 2070 SUPER ICHILL BLACK
80 fps (avg) (51%)
MSI GeForce RTX 3060 GAMING X 12G
80 fps (avg) (51%)
ZOTAC GAMING GeForce RTX 3060 AMP White Edition
80 fps (avg) (51%)
Shadow of the Tomb Raider - 1920x1080 (1080p)
MSI GeForce RTX 2080 Ventus 8G V2
125 fps (avg) (62%)
ASUS Dual GeForce RTX 2080
125 fps (avg) (62%)
INNO3D GeForce RTX 2070 SUPER ICHILL BLACK
118 fps (avg) (59%)
GIGABYTE AORUS GeForce RTX 2070 SUPER 8G
118 fps (avg) (59%)
ASUS ROG Strix GeForce RTX 3060 OC Edition
118 fps (avg) (59%)
Crypto-Mining Ethereum Hashrate (MH/s) - Ethash Hashrate
GIGABYTE AORUS GeForce RTX 3070 Ti EAGLE OC 8G
45 MH/s (37%)
Gainward GeForce RTX 3070 Ti Phoenix
45 MH/s (37%)
INNO3D GeForce RTX 2070 SUPER ICHILL BLACK
43 MH/s (36%)
ASUS Dual GeForce RTX 2080 OC
43 MH/s (36%)
ASUS Dual GeForce RTX 2080 OC Evo
43 MH/s (36%)
Crypto-Mining Ergo Hashrate (MH/s) - Autolykos 2 Hashrate
MSI Radeon RX 6700 XT GAMING 12G
87 MH/s (33%)
MSI Radeon RX 6700 XT 12G
87 MH/s (33%)
INNO3D GeForce RTX 2070 SUPER ICHILL BLACK
83 MH/s (31%)
ASUS Dual GeForce RTX 2080 SUPER OC Evo V2
83 MH/s (31%)
ASUS ROG Strix GeForce RTX 2080 SUPER OC White
83 MH/s (31%)
Crypto-Mining Ravencoin Hashrate (MH/s) - KawPow Hashrate
XFX Radeon RX Vega 64 Black Fan
24 MH/s (49%)
ASUS Mining Radeon RX Vega 64
24 MH/s (49%)
INNO3D GeForce RTX 2070 SUPER ICHILL BLACK
23 MH/s (47%)
ASUS ROG Strix GeForce RTX 3060 Ti OC
23 MH/s (47%)
MSI GeForce RTX 3060 Ti Gaming X Trio 8G
23 MH/s (47%)
Crypto-Mining Vertcoin Hashrate (MH/s) - Verthash Hashrate
MSI GeForce RTX 2070 ARMOR 8G OC
0.59 MH/s (30%)
ZOTAC GAMING GeForce RTX 2070 AMP
0.59 MH/s (30%)
GIGABYTE GeForce RTX 2070 Windforce 8G (rev. 2.0)
0.58 MH/s (30%)
ASUS Dual GeForce RTX 2070 Mini
0.58 MH/s (30%)
ASUS Dual GeForce RTX 2070 Evo V2
0.58 MH/s (30%)
热门比较
INNO3D GeForce RTX 2070 SUPER ICHILL BLACK vs
ASUS ROG Strix GeForce RTX 3080 GUNDAM EDITION
XFX Radeon RX 5700 XT Thicc II vs
INNO3D GeForce RTX 2070 SUPER ICHILL BLACK
INNO3D GeForce RTX 2070 SUPER ICHILL BLACK vs
MSI GeForce RTX 3080 Ti Ventus 3X 12G OC
Palit GeForce RTX 2070 GamingPro OC vs
INNO3D GeForce RTX 2070 SUPER ICHILL BLACK
ASUS Dual GeForce RTX 2080 OC Evo vs
INNO3D GeForce RTX 2070 SUPER ICHILL BLACK
ZOTAC GAMING GeForce RTX 3060 AMP White Edition vs
INNO3D GeForce RTX 2070 SUPER ICHILL BLACK
Gainward GeForce RTX 2080 SUPER Phantom GLH vs
INNO3D GeForce RTX 2070 SUPER ICHILL BLACK
ASUS TUF Gaming GeForce RTX 3070 Ti vs
INNO3D GeForce RTX 2070 SUPER ICHILL BLACK
MSI GeForce RTX 3080 Ti Ventus 3X 12G vs
INNO3D GeForce RTX 2070 SUPER ICHILL BLACK
MSI GeForce RTX 3060 VENTUS 3X 12G OC vs
INNO3D GeForce RTX 2070 SUPER ICHILL BLACK