ZOTAC GAMING GeForce RTX 2080 Ti AMP Extreme Core
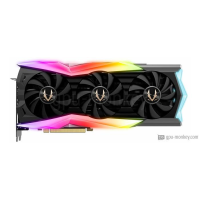
ZOTAC GAMING GeForce RTX 2080 Ti AMP Extreme Core launched Q3/2018, which is based on NVIDIA GeForce RTX 2080 Ti architecture. It will come with 11 GB of high-bandwidth GDDR6 memory.The ZOTAC GAMING GeForce RTX 2080 Ti AMP Extreme Core features 4352 shader, 88 render output units, has a boost clock of 1.755 GHz+ 14 % and equipped with a power draw of 300 W + 20 %. The GPU supports up to 4 monitors with resolutions of 7680x4320. In addition, if you are looking for Air cooling cooler & Axial fan-type, it would be your best choice.
| Based on | NVIDIA GeForce RTX 2080 Ti |
| GPU Chip | TU102 |
| Execution units | 68 |
| Shader | 4352 |
| Render Output Units | 88 |
| Texture Units | 272 |
| Memory Size | 11 GB |
| Memory Type | GDDR6 |
| Memory Speed | 1.8 GHz |
| Memory Bandwith | 634 GB/s |
| Memory Interface | 352 bit |
Where to Buy?
Buy ZOTAC GAMING GeForce RTX 2080 Ti AMP Extreme Core
Clock Speeds
| Base Clock | 1.350 GHz |
| Boost Clock | 1.755 GHz+ 14 % |
| Avg (Game) Clock | 1.545 GHz |
| Overclocking |
Yes |
Thermal Design
| TDP | 300 W+ 20 % |
| TDP (up) | -- |
| Tjunction max | -- |
| PCIe-Power | 2 x 8-Pin |
Cooler & Fans
| Fan-Type | Axial |
| Fan 1 | 3 x 90 mm |
| Fan 2 | -- |
-
| Cooler-Type | Air cooling |
| Noise (Idle) | 0 dB / Silent |
| Noise (Load): | -- |
Connectivity
| Max. Displays | 4 |
| HDCP-Version | 2.2 |
| HDMI Ports | 1x HDMI v2.0b |
| DP Ports | 3x DP v1.4a |
| DVI Ports | -- |
| VGA Ports | -- |
| USB-C Ports | 1 |
Featureset
| Max. resolution | 7680x4320 |
| DirectX | 12_2 |
| Raytracing |
Yes |
| DLSS / FSR |
Yes |
| LED | ZOTAC SPECTRA |
Supported Video Codecs
| h264 | Decode / Encode |
| h265 / HEVC | Decode / Encode |
| AV1 |
No |
-
| VP8 | Decode |
| VP9 | Decode |
| Noise (Load): | -- |
Dimensions
| Length | 324 mm |
| Height | 136 mm |
| Width | 59 mm |
| Width (Slots) | 3 PCIe-Slots |
| Weight | -- |
Additional data
| GPU Interface | PCIe 3.0 x 16 |
| Release date | Q3/2018 |
| Release price | -- |
| Structure size | 12 nm |
| Part-no | ZT-T20810C-10P |
FP32 Performance (Single-precision TFLOPS) - FP32 (TFLOPS)
MSI GeForce RTX 2080 Ti Lightning Z
15.41 (38%)
ASUS ROG Strix GeForce RTX 2080 Ti OC White
15.41 (38%)
MSI GeForce RTX 2080 Ti Sea Hawk EK X
15.28 (38%)
MSI GeForce RTX 2080 Ti Gaming Z Trio
15.28 (38%)
3DMark Benchmark - Time Spy (Performance) Graphics score
MSI GeForce RTX 3070 Ti SUPRIM X 8G
15028 (72%)
GIGABYTE AORUS GeForce RTX 3070 Ti MASTER 8G
15028 (72%)
MSI GeForce RTX 2080 Ti Sea Hawk EK X
14992 (72%)
MSI GeForce RTX 2080 Ti Gaming Z Trio
14992 (72%)
3DMark Benchmark - Fire Strike (Extreme) Graphics score
MSI Radeon RX 6700 XT MECH 2X 12G OC
17200 (58%)
ASRock Radeon RX 6700 XT Challenger Pro 12GB OC
17200 (58%)
MSI GeForce RTX 2080 Ti Sea Hawk EK X
17190 (58%)
MSI GeForce RTX 2080 Ti Gaming Z Trio
17190 (58%)
Battlefield 5 - 3840x2160 (2160p)
GALAX GeForce RTX 3070 Ti EXG White (1-Click OC)
85 fps (avg) (71%)
GALAX GeForce RTX 3070 Ti EXG (1-Click OC)
85 fps (avg) (71%)
ZOTAC GAMING GeForce RTX 2080 Ti AMP Extreme Core
84 fps (avg) (71%)
MSI GeForce RTX 2080 Ti Gaming Z Trio
84 fps (avg) (71%)
ASUS ROG Strix GeForce RTX 2080 Ti OC White
84 fps (avg) (71%)
Battlefield 5 - 2560x1440 (1440p)
ASUS ROG Matrix GeForce RTX 2080 Ti Platinum
142 fps (avg) (71%)
MSI GeForce RTX 3070 Gaming X Trio 8G
142 fps (avg) (71%)
ZOTAC GAMING GeForce RTX 2080 Ti AMP Extreme Core
141 fps (avg) (70%)
GIGABYTE GeForce RTX 3070 Vision OC 8G
141 fps (avg) (70%)
GIGABYTE GeForce RTX 3070 Gaming OC 8G
141 fps (avg) (70%)
Battlefield 5 - 1920x1080 (1080p)
ASRock Radeon RX 6700 XT Challenger Pro 12GB OC
192 fps (avg) (95%)
ASUS Radeon RX 6700 XT
192 fps (avg) (95%)
ZOTAC GAMING GeForce RTX 2080 Ti AMP Extreme Core
191 fps (avg) (95%)
ASUS ROG Strix GeForce RTX 3080 OC White
191 fps (avg) (95%)
ASUS ROG Strix GeForce RTX 3080 OC
191 fps (avg) (95%)
Shadow of the Tomb Raider - 3840x2160 (2160p)
GIGABYTE AORUS GeForce RTX 2080 Ti Xtreme Waterforce WB 11G
62 fps (avg) (65%)
EVGA GeForce RTX 2080 Ti Kingpin Gaming
62 fps (avg) (65%)
ZOTAC GAMING GeForce RTX 2080 Ti AMP Extreme Core
61 fps (avg) (64%)
MSI GeForce RTX 2080 Ti Sea Hawk EK X
61 fps (avg) (64%)
MSI GeForce RTX 2080 Ti Gaming Z Trio
61 fps (avg) (64%)
Shadow of the Tomb Raider - 2560x1440 (1440p)
Colorful iGame GeForce RTX 2080 Ti Vulcan X OC-V
114 fps (avg) (72%)
GIGABYTE AORUS GeForce RTX 2080 Ti Xtreme 11G
114 fps (avg) (72%)
ZOTAC GAMING GeForce RTX 2080 Ti AMP Extreme Core
113 fps (avg) (72%)
PowerColor Radeon RX 6800 Red Devil Limited Edition
113 fps (avg) (72%)
PowerColor Radeon RX 6800 Red Dragon
113 fps (avg) (72%)
Shadow of the Tomb Raider - 1920x1080 (1080p)
EVGA GeForce RTX 2080 Ti Kingpin Gaming
148 fps (avg) (74%)
Colorful iGame GeForce RTX 2080 Ti Vulcan X OC-V
148 fps (avg) (74%)
ZOTAC GAMING GeForce RTX 2080 Ti AMP Extreme Core
147 fps (avg) (73%)
MSI GeForce RTX 2080 Ti Sea Hawk EK X
147 fps (avg) (73%)
MSI GeForce RTX 2080 Ti Gaming Z Trio
147 fps (avg) (73%)
Crypto-Mining Ethereum Hashrate (MH/s) - Ethash Hashrate
MSI GeForce RTX 3060 Ti Gaming X 8G
61 MH/s (50%)
Palit GeForce RTX 3060 Ti Dual
61 MH/s (50%)
ZOTAC GAMING GeForce RTX 2080 Ti AMP Extreme Core
60 MH/s (50%)
ASUS ROG Matrix GeForce RTX 2080 Ti Platinum
60 MH/s (50%)
ASUS ROG Strix GeForce RTX 2080 Ti OC White
60 MH/s (50%)
Crypto-Mining Ergo Hashrate (MH/s) - Autolykos 2 Hashrate
ASUS ROG Matrix GeForce RTX 2080 Ti Platinum
119 MH/s (45%)
ZOTAC GAMING GeForce RTX 2080 Ti AMP Extreme
119 MH/s (45%)
ZOTAC GAMING GeForce RTX 2080 Ti AMP Extreme Core
118 MH/s (45%)
MSI GeForce RTX 2080 Ti Gaming Z Trio
118 MH/s (45%)
ASUS ROG Strix GeForce RTX 2080 Ti OC White
118 MH/s (45%)
Crypto-Mining Ravencoin Hashrate (MH/s) - KawPow Hashrate
EVGA GeForce RTX 3070 Ti XC3 GAMING
38 MH/s (78%)
INNO3D GeForce RTX 3070 Ti X3 OC
38 MH/s (78%)
ZOTAC GAMING GeForce RTX 2080 Ti AMP Extreme Core
34 MH/s (69%)
ASUS ROG Matrix GeForce RTX 2080 Ti Platinum
34 MH/s (69%)
ASUS ROG Strix GeForce RTX 2080 Ti OC White
34 MH/s (69%)
Crypto-Mining Vertcoin Hashrate (MH/s) - Verthash Hashrate
Colorful iGame GeForce RTX 2080 Ti Kudan-V
0.88 MH/s (45%)
XFX Speedster MERC 319 Radeon RX 6900 XT Limited Black Gaming
0.88 MH/s (45%)
ZOTAC GAMING GeForce RTX 2080 Ti AMP Extreme Core
0.87 MH/s (45%)
Sapphire Toxic Radeon RX 6900 XT Limited Edition (rev 2.0)
0.87 MH/s (45%)
ASUS ROG Strix LC Radeon RX 6900 XT OC
0.87 MH/s (45%)
Popular Comparision
ZOTAC GAMING GeForce RTX 2080 Ti AMP Extreme Core vs
GIGABYTE AORUS GeForce RTX 3060 Elite 12G
ZOTAC GAMING GeForce RTX 2080 Ti AMP Extreme Core vs
ZOTAC Gaming GeForce RTX 3070 AMP Holo
ZOTAC GAMING GeForce RTX 2080 Ti AMP Extreme Core vs
Palit GeForce RTX 3060 StormX OC
ZOTAC GAMING GeForce RTX 2080 Ti AMP Extreme Core vs
EVGA GeForce RTX 2080 Ti FTW3 Gaming
ZOTAC GAMING GeForce RTX 2080 Ti AMP Extreme Core vs
GIGABYTE GeForce RTX 3070 Gaming OC 8G
ZOTAC GAMING GeForce RTX 2080 Ti AMP Extreme Core vs
PowerColor Radeon RX 5700 XT Red Devil Limited Edition
ZOTAC GAMING GeForce RTX 2080 Ti AMP Extreme Core vs
ASUS KO GeForce RTX 3070 OC
ZOTAC GAMING GeForce RTX 2080 Ti AMP Extreme Core vs
Gainward GeForce RTX 3060 Ti Phoenix
ASUS Dual GeForce GTX 1660 OC EVO vs
ZOTAC GAMING GeForce RTX 2080 Ti AMP Extreme Core
ZOTAC GAMING GeForce RTX 2080 Ti AMP Extreme Core vs
GIGABYTE AORUS GeForce RTX 3080 Ti Master 12G
ZOTAC GAMING GeForce RTX 2080 Ti AMP Extreme Core vs
GIGABYTE GeForce RTX 2070 SUPER WINDFORCE 3X 8G
ZOTAC GAMING GeForce RTX 2080 Ti AMP Extreme Core vs
Gainward GeForce RTX 3080 Phoenix GS V1 LHR
ZOTAC GAMING GeForce RTX 2080 Ti AMP Extreme Core vs
Palit GeForce GTX 1660 SUPER GP
ZOTAC GAMING GeForce RTX 2080 Ti AMP Extreme Core vs
ZOTAC GAMING GeForce RTX 2080 Ti AMP Extreme
ZOTAC GAMING GeForce RTX 2080 Ti AMP Extreme Core vs
ASUS TUF Gaming Radeon RX 6700 XT OC Edition
ZOTAC GAMING GeForce RTX 2080 Ti AMP Extreme Core vs
GIGABYTE GeForce GTX 1070 G1 ROCK 8G
ZOTAC GAMING GeForce RTX 2080 Ti AMP Extreme Core vs
GIGABYTE GeForce RTX 3060 Ti Vision OC 8G (rev. 2.0) LHR
ZOTAC GAMING GeForce RTX 2080 Ti AMP Extreme Core vs
MSI GeForce RTX 3060 GAMING X 12G